Summary
- In the stock market, there has historically been a pronounced correlation between what occurs in January and what happens for the remainder of that year.
- The January 2014 correction and subsequent rally have left some significant negative divergences and subsurface weakness, which the indexes are masking.
- The “January Barometer” is firmly in place, insider selling is at alarmingly high levels and margin debt is being used in a reckless fashion.
- Thus, we feel the stage has been set for a nasty spill in the stock market.
The January Barometer has been much debated over the years, yet the data clearly supports the fact that stock market performance in
the first month of the year predicts performance for the remainder of
that year. The charts to the right clearly illustrate what a strong
January leads to for the rest of that year versus what occurs when
a weak January has occurred. A data outlier occurs for 2009
(second chart). In 2009 we were just coming off the 2008 crash.
January 2009 was down 8%, yet yearly performance was actually
up 23%. This outlier does not negate the efficacy of the January
Barometer; entering another bear market would be highly unlikely
after having just experienced such a significant crash.

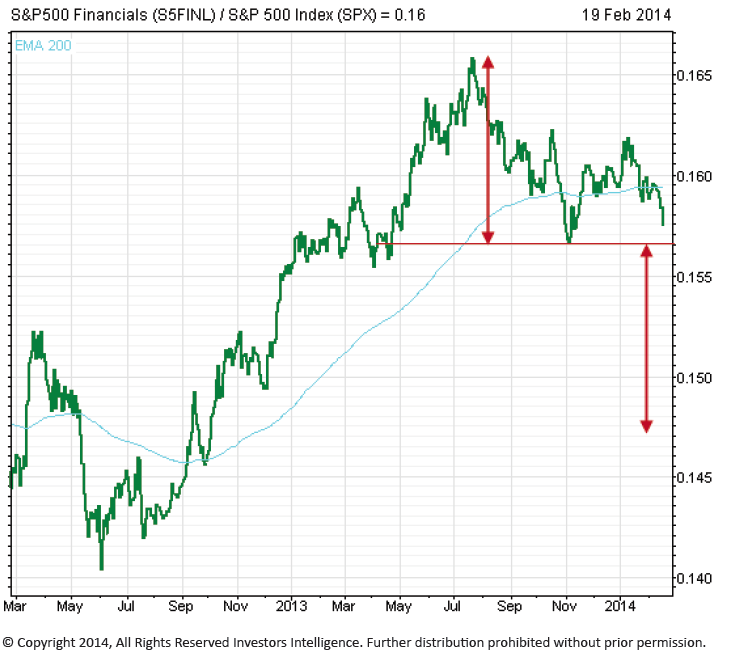
Until recently, the financials have participated in the general upswing in equities. However, over the last six months financials have begun to
underperform the stock market. This is a concern because when financial institutions begin to have difficulties, problems are exacerbated and spill over into the general economy.
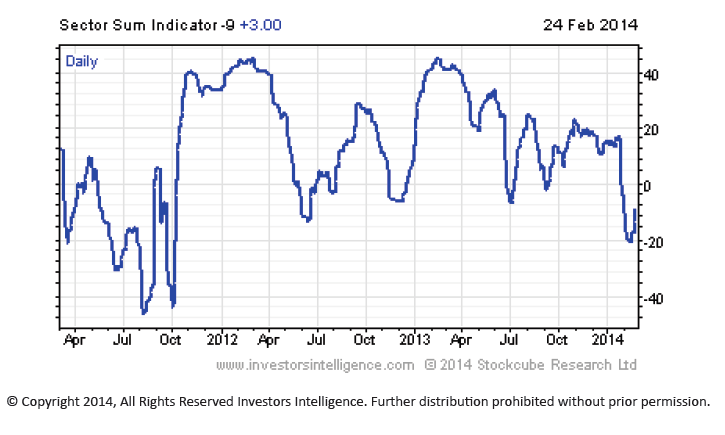
The Sector Sum Short- Term Status is determined by its chart direction in combination with the direction of the group’s cumulative advance decline line and the last three day’s direction on the NYSE bullish %. Not only has the Sector Sum been on a sell signal, but it has also been making a series of lower highs over the last 12 months. The indexes, in comparison, have been making higher highs. This shows that not all sectors are moving up higher with the market. Although the indexes have moved higher, the Sector Sum Indicator is showing subsurface
weakness and deterioration.
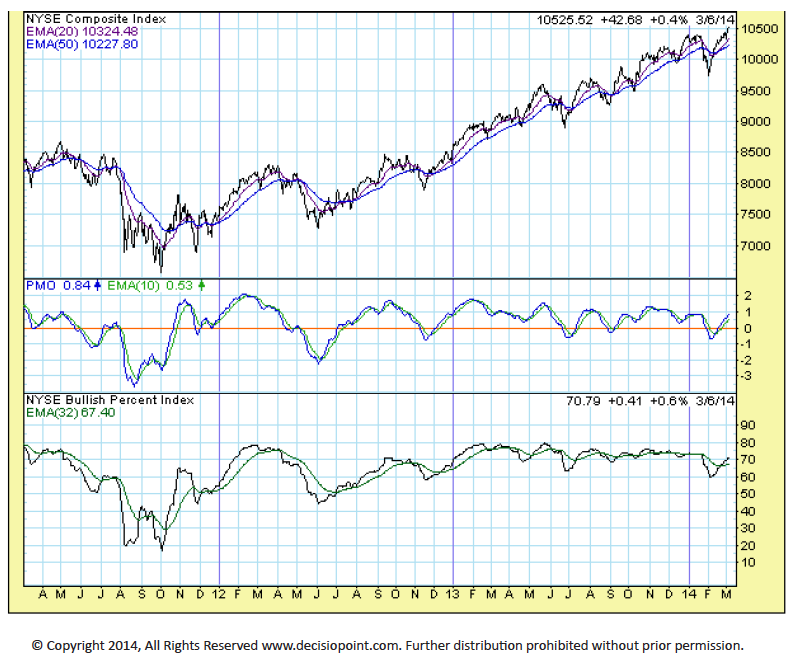
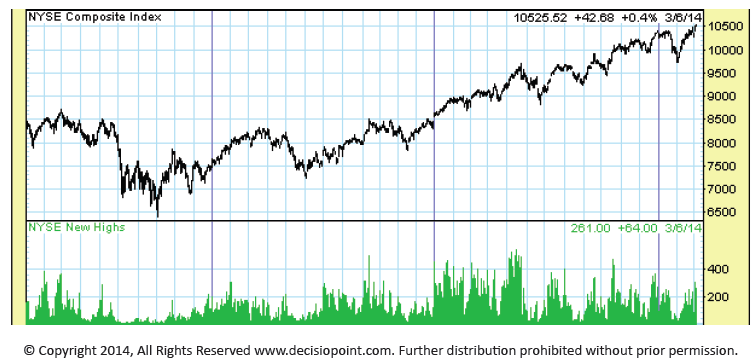
One can see in the chart below that although the indexes have been moving higher over the last six months, the number of 52-week highs has been in steady decline. This warning sign is a direct symptom of a narrowing tape.
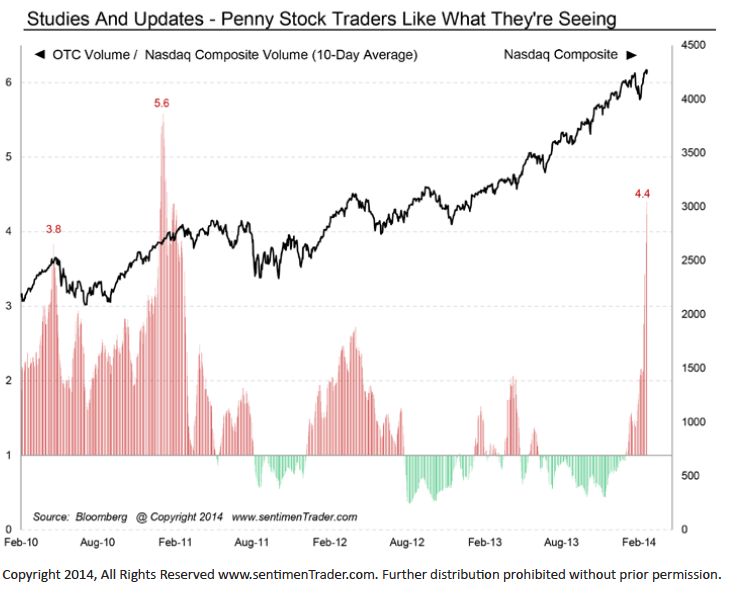
It is useful to gauge speculative fervor in the Over-the-Counter market. At this time we are noticing a significant spike in speculation. Since February 10th there has been increased volume in penny stocks relative to the NASDAQ Composite volume. This activity is a warning sign; traders are becoming extremely active in penny stocks, which are traditionally speculative in nature.
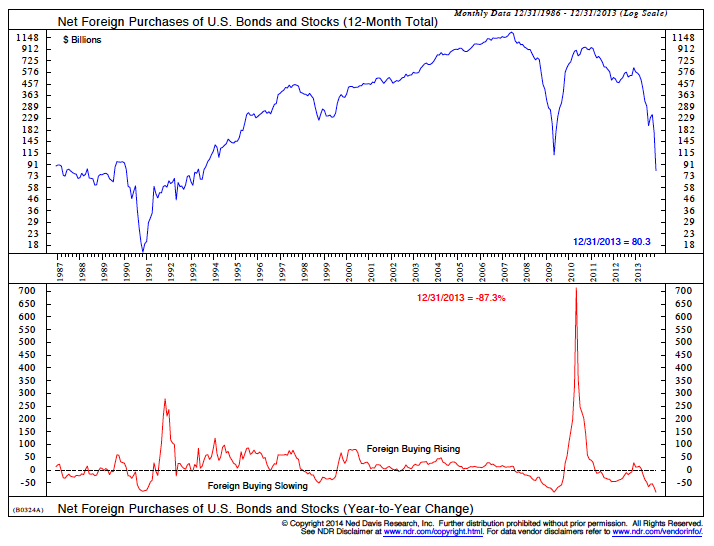
While corporations have been a steady buyer of stocks, foreigners have begun to sell US securities. In fact, their purchases have fallen to a 20-year low. This move downward encompasses both official institutions and private investors.
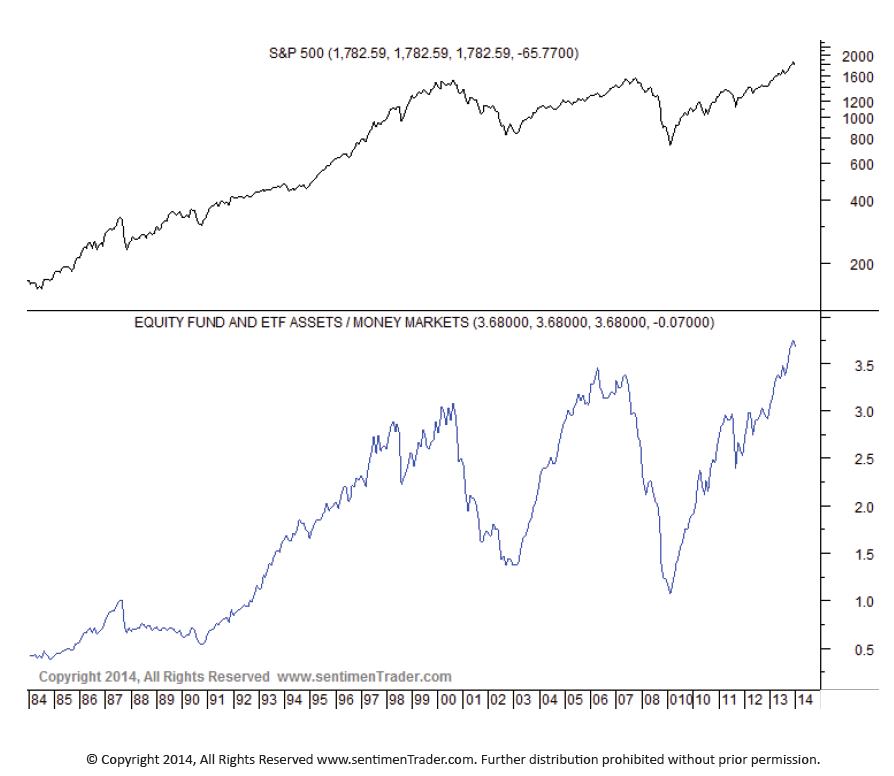
There is currently 3.68 times more money allocated to stocks than is
invested in money market funds. This is a 30-year high. The last two peaks occurred during the top of the last two markets of 2000 and 2007. While most believe there is plenty of cash on the sidelines, this
ratio indicates otherwise and is a significant intermediate term negative.
Sentiment
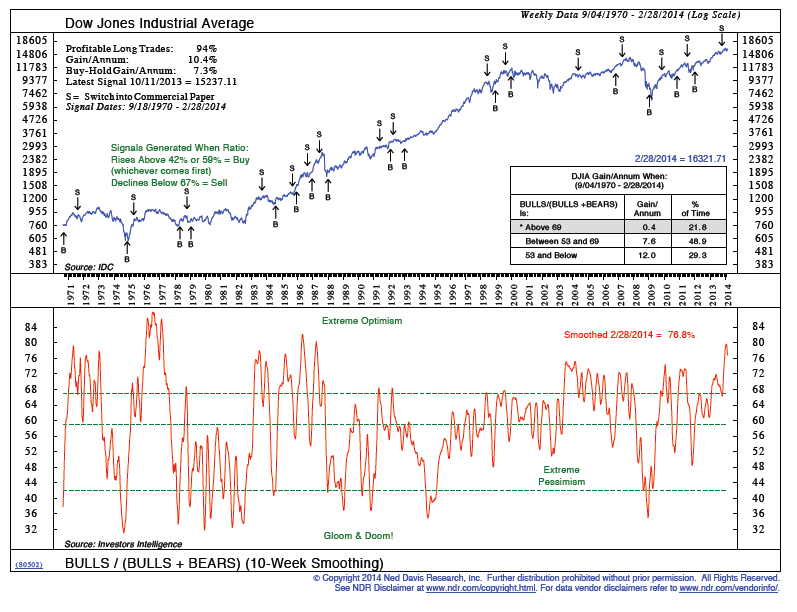
The Bulls/ (Bulls+Bears) sentiment gauge remains at a lofty level. Thecurrent reading of 78 reflects an overoptimistic marketplace with high
expectations. Margin debt is also at an all-time peak, reinforcing our assertion that speculation is running high.
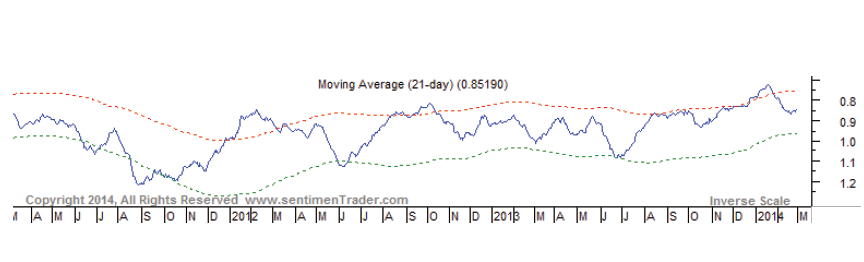
The CBOE 25-day Total PutCall ratio is designed to monitor monthly put versus call activity. It is used in a contrary fashion, meaning that when more puts are purchased it is a bullish sign and vice versa. The most recent reading of .83 shows that currently excessive call buying is taking place, which is extremely bearish.
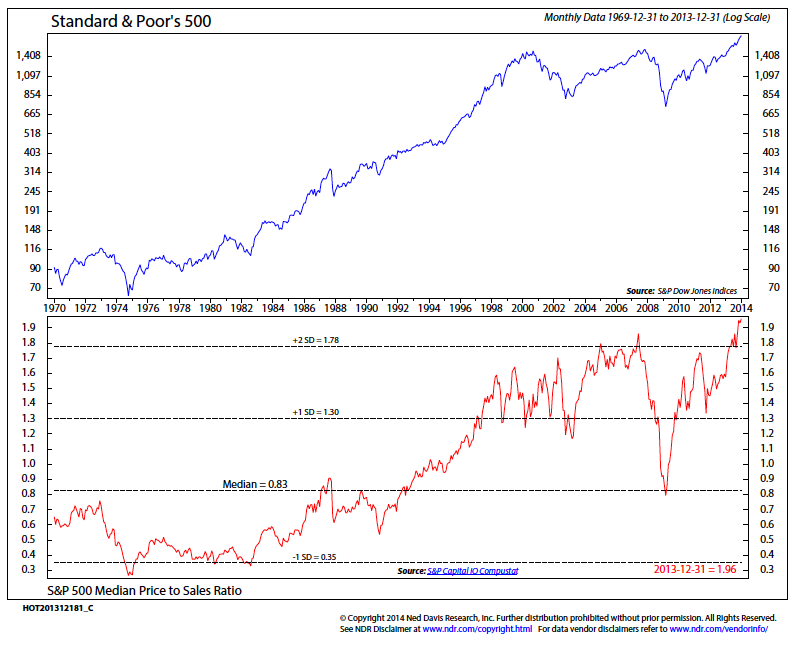
We’ve written about Price To Sales in previous issues of LMTR. This
indicator recently hit a 50-year high. Many fundamentalists assert that the stock market is “cheap”, but we do not believe that this is the case. Sales are extremely difficult to manipulate through earnings buybacks, and the current reading of two standard deviations from the mean is extremely bearish.
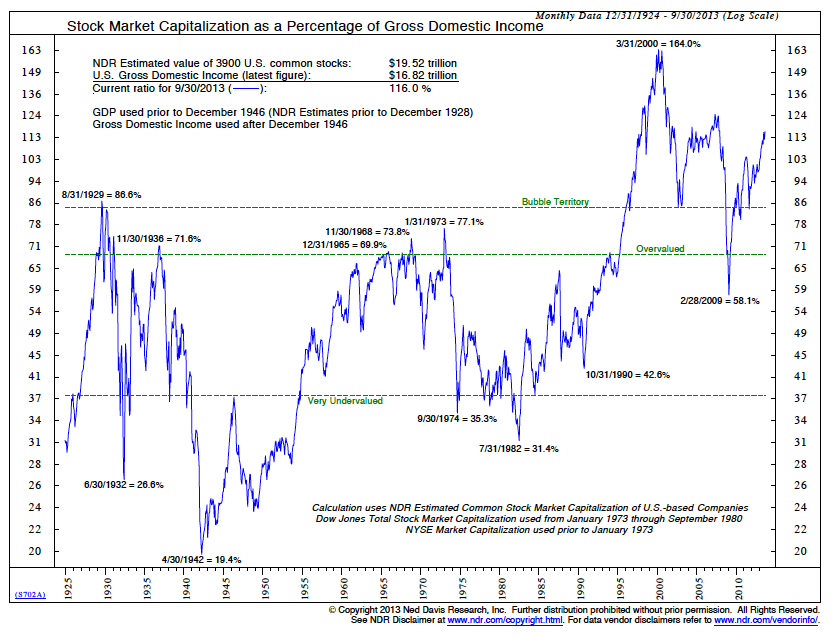
The primary concept expressed in this final chart is a comparison of stock market value relative to GDP. We are presently above 2007 levels and are fast approaching 2000 levels on this indicator. Such distortion typically occurs during periods when stocks are overvalued in comparison to the GDI.
Conclusion
The January correction and subsequent February rally have created some negative divergences. As the indexes continue to advance, more and more indicators and fewer and fewer stocks are participating in each upswing. Sentiment, margin debt and insider selling are all in red-hot sell zones. In fact, insider selling has accelerated 30% over the preceding period. Such negative readings lead us to maintain our 32% short position.
Disclaimer
Lamensdorf
Market Timing Report is a publication intended to give analytical
research to the investment community. Lamensdorf Market Timing Report is
not rendering investment advice based on investment portfolios and is
not registered as an investment advisor in any jurisdiction. Information
included in this report is derived from many sources believed to be
reliable but no representation is made that it is accurate or complete,
or that errors, if discovered, will be corrected. The authors of this
report have not audited the financial statements of the companies
discussed and do not represent that they are serving as independent
public accountants with respect to them. They have not audited the
statements and therefore do not express an opinion on them. The authors
have also not conducted a thorough review of the financial statements as
defined by standards established by the AICPA. This report is not intended, and shall not constitute, and nothing herein should be construed as, an offer to sell or a solicitation of an offer to buy any securities referred to in this report, or a “buy” or “sell” recommendation. Rather, this research is intended to identify issues portfolio managers should be aware of for them to assess their own opinion of positive or negative potential.
No comments:
Post a Comment