Summary
- US natural gas prices should remain low over the next few years, unless we're on the cusp of a new ice age.
- Associated gas production from liquids-rich plays continues
to grow, while increased drilling efficiency, process innovation and
improved completion techniques have enabled operators to extract more
gas from fewer rigs.
- An uptick in domestic demand and exports are still a ways off.
- Overlooked shadow capacity in the Haynesville Shale and
other plays will ensure that any meaningful increase in natural-gas
prices is short-lived.
Despite persistent weakness, pundits continue to call false
bottoms in natural gas prices and recommend shares of companies that
produce primarily natural gas.
Far too many investors and talking heads were head-faked
by the weather-driven spike in natural gas that occurred in early 2014,
buying shares of
Cabot Oil & Gas Corp (NYSE:
COG) and other names with sizable acreage positions in the
Marcellus Shale.
Here's why North American natural gas prices should remain low over the next two to three years.
Reason No. 1: US Natural Gas Production Remains Strong despite Low Prices
The
investment media made a big deal about last winter's upsurge in natural
gas prices, a phenomenon that stemmed from severely cold weather, not a
lasting change in the underlying supply and demand conditions.
Many
investors and media outlets focus on the spot market, where volumes are
available for immediate delivery. This price benchmark is much more
vulnerable to seasonal weather conditions.
In contrast, oil and
gas producers focus on the 12-month strip, or the average cost of
natural gas for delivery over the next year. This forward-looking
benchmark
smoothes out weather-related fluctuations and other
temporary blips, providing better insight into the producer's full-year
price realizations.
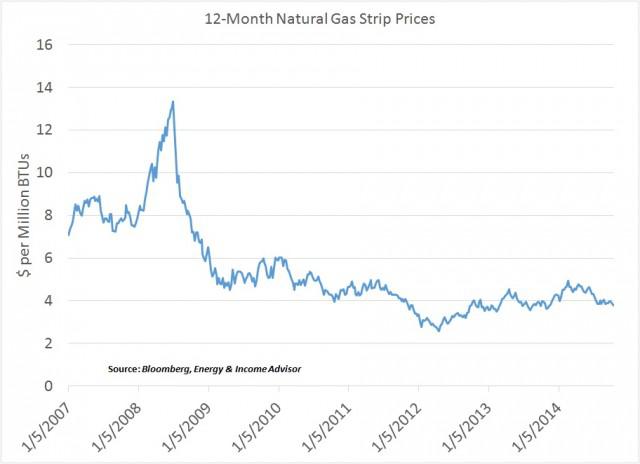
On
this basis, North American natural gas prices have fluctuated around $4
per million British thermal units over the past four years, with the
high and low end of this range marked by the no-show 2011-12 winter and
the polar vortex earlier this year.
Plummeting natural gas prices
from mid-2008 to late 2009 prompted many upstream operators to scale
back drilling activity in the Haynesville Shale and other plays that
primarily produce this out-of-favor commodity.
However, the decline in gas-directed drilling activity hasn't resulted in a commensurate decline in US production.
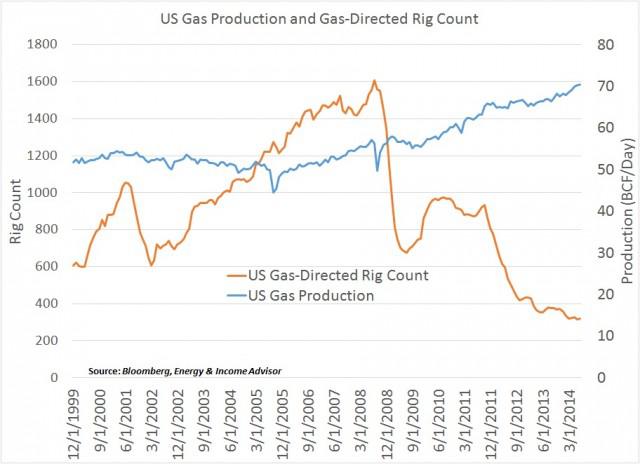
Prior
the shale revolution, a decline in the number of active rigs targeting
natural gas would translate into lower production - exactly what
happened when drilling activity slumped from mid-2001 to mid-2002.
But the traditional relationship between the gas-directed rig count and production completely broke down in 2008.
Although
the number of rigs targeting natural gas collapsed from more than 1,600
in mid-2008 to 310 units in April 2014, US production has soared from
57 billion cubic feet per day to 70 billion cubic feet per day in July
2014.
This divergence reflects two factors:
Producers ramping up drilling activity in liquids-rich plays that also yield significant volumes of crude oil and
natural gas liquids; and
Huge gains in efficiency as producers hone their drilling and completion techniques and address supply-chain bottlenecks.
You can read more about these trends in
Breaking Down the US Onshore Rig Count and
Salute Your Drillmasters: Efficiency Gains Lower Production Costs.
As
the energy industry has transitioned to pad drilling and optimized well
designs and completion techniques, operators have produced more natural
gas from fewer active rigs.
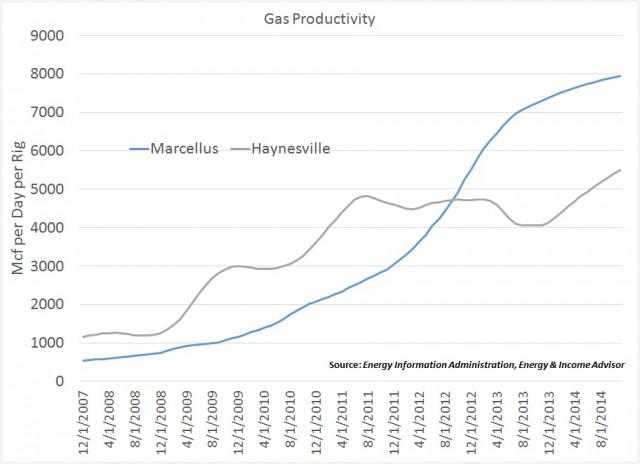
Over
the past two years, output per rig has increased by more than 50
percent in the Marcellus Shale, effectively lowering producers'
break-even costs to about $2 per million British thermal units in the
play's liquids-rich fairway.
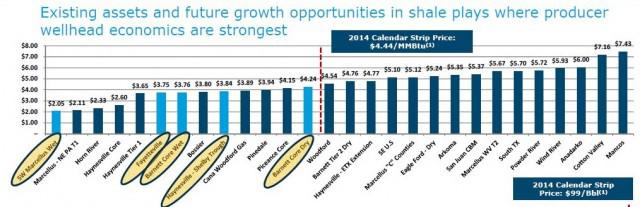
Source:
Crestwood Midstream Partners LP
These
efficiency gains, coupled with readily available credit and independent
producers' imperative to grow their hydrocarbon output, mean that
natural-gas prices near $4 per million British thermal units are no
longer a disincentive to production.
But back in 2008, many
producers needed natural gas to fetch $7 to $8 per million British
thermal units to support drilling activity in higher-cost resource
plays.
In addition, 15 percent to 20 percent of US natural gas
production comes from oil wells, a figure that could increase in coming
years as more gas-gathering and processing infrastructure comes onstream
in the Bakken Shale.
Bottom Line: As long as crude oil remains above $70 per barrel, volumes of associated natural gas should continue to climb.
We
also expect North American crude-oil output to remain more resilient
than some expect because of hedging programs that lock in prices on
future output and independent producers allocating more capital to core
acreage that generates the best internal rates of return.
Reason No. 2: The Demand Response Won't Move the Needle Right Away
Over
the past few years, energy companies have proposed the construction of
more than 30 terminals to export liquefied natural gas (LNG). Thus far,
the Federal Energy Regulatory Commission (FERC) has approved only four
projects - about 6 billion cubic feet per day - to move forward.
But
the market itself will dictate how much LNG export capacity the US
adds; given the capital intensity of these projects, only terminals that
have secure volume commitments from customers will be able to obtain
the necessary financing. (See
Understanding the Appeal of US LNG Exports.)
The
case for LNG exports is deceptively simple: Whereas the 12-month strip
for US natural gas prices hovers around $3.60 per million British
thermal units, this commodity fetches $9 per million British thermal
units in Europe and $16 per million British thermal units in Asia.
When
you factor in the $6 to $7 per million British thermal units that it
would cost to liquefy and ship LNG from the Gulf Coast to Asia, these
price advantages appear slightly less compelling. Liquefaction and
shipping costs for cargoes headed to Europe are expected to range from
$3 to $4 per million British thermal units.
Cheniere Energy Partners LP's (NYSE:
CQP)
Sabine Pass facility is slated to start exporting LNG from the US Gulf
Coast in late 2015 or early 2016. More capacity will come onstream by
2020. By 2021, the US will also export more natural gas to Mexico and
Canada via pipeline than it imports.
All told, the Energy
Information Administration (EIA) forecasts that the US will export about
2 trillion cubic feet of natural gas annually by 2020 - about 7 percent
of projected supplies.
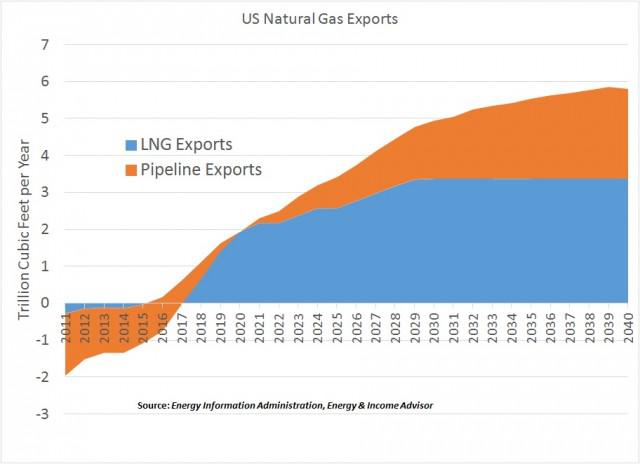
The
EIA's longer-term outlook contemplates the US exporting 5.8 trillion
cubic feet of natural gas per year and 37.5 trillion cubic feet in
annual production. Although long-range projections in the energy patch
should be taken with a grain of salt, US exports would account for only
15 percent of domestic output in this scenario.
And if US natural
gas prices were to rally temporarily, the price advantage for customers
in Asia and Europe would diminish, eroding demand in the international
spot market.
Commentators who predict a surge in natural gas
demand from electric utilities likewise overlook the scope that power
producers have to switch between coal and natural gas at their plants,
depending on which thermal fuel offers the best economics.
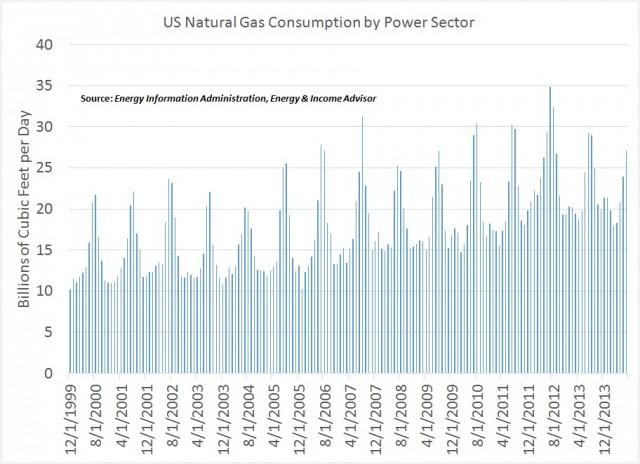
Natural gas consumption in the power sector spiked in 2012 after the no-show winter depressed the price of this commodity.
But
electric utilities have reduced their natural gas consumption over the
past two years. In July 2014, the power sector burned about 7.8 billion
cubic feet per day of natural gas less than in 2012.
The
catalysts for this trend: Depressed coal prices and natural gas prices
that remained elevated after the severely cold 2013-14 winter, a
situation that incentivized electric utilities to switch fuels.
In
July 2014, US electricity demand fell 2.3 percent year over year
because of a more than 12 percent drop in total cooling degree day.
Natural gas consumption in the power sector tumbled 7.3 percent, while
coal demand dropped 1.9 percent.
Stricter regulation of carbon
dioxide emissions will lead to the shutdown of as much as 50 to 60
gigawatts of coal-fired generation capacity in the US-roughly 15 percent
to 20 percent of the current fleet. About 30 gigawatts could be
shuttered by the end of next year.
Although the anticipated
reduction in coal-fired capacity will be offset by an increased reliance
on natural gas, the 1 trillion cubic feet per annum in incremental
demand that's expected to materialize by 2020 won't offset a 4.5
trillion cubic feet jump in annual production.
Reason No. 3: Overlooked Shadow Capacity
In
the global crude-oil market, analysts pay close attention to OPEC's
spare production capacity, or oil fields that could ramp up output
quickly to offset a supply outage and rebalance the market.
Saudi
Arabia controls much of this spare capacity and stepped up its output in
2011 to dampen the Libyan civil war's effect on global oil prices.
Similarly,
North America boasts a number of prolific natural gas plays in which
producers could accelerate drilling activity if prices were to climb to
between $4.50 and $5 per million British thermal units.
Based on
total reserves, Louisiana's Haynesville Shale is one of the largest gas
plays in the US. However, this play has fallen out of favor because it
produces negligible volumes of crude oil and natural gas liquids,
higher-priced hydrocarbons that help to boost economics.
This
unfavorable production mix explains why drilling activity in the
Haynesville Shale slumped sharply after 2008 and gas production from
this field had plummeted by almost one-third from its peak.
However,
the Haynesville Shale's rig count and production levels appear to have
bottomed last winter, suggesting that natural gas prices over $4.50 per
million British thermal units would incentivize producers to accelerate
drilling activity in the play's core region.
Most analysts
estimate that natural gas prices of $5 per million British thermal units
would enable producers to make money in the marginal portions of the
Haynesville Shale.
The region already boasts sufficient pipeline
and processing capacity to handle an increase in production, while its
proximity to proposed export capacity on the Gulf Coast is another plus.
In
short, any sustained upsurge in North American natural-gas prices would
be stymied by an influx of output from the Haynesville Shale and other
plays.
The current natural gas futures curve projects that prices
generally will remain below $5 per million British thermal through at
least the middle of the coming decade.
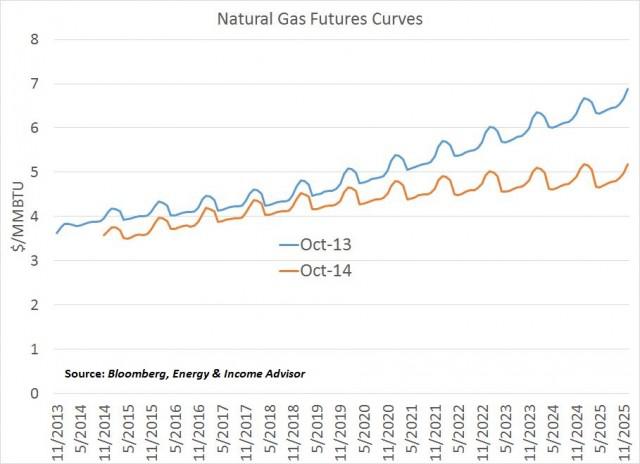
Futures
market expectations for gas prices are lower today than they were a
year ago; the rapid build in inventories has convinced the market that
significant structural changes will need to take place to tighten the
supply-demand balance for more than a month or two.
 2200
2200