(click to enlarge)
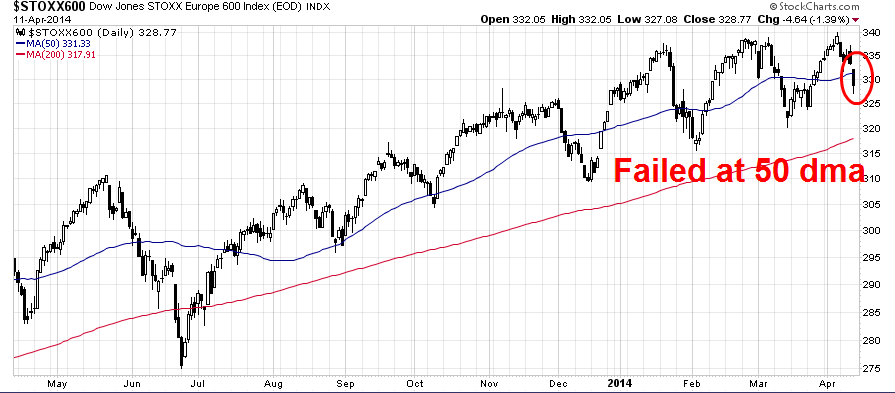
The carnage was not just isolated in America. European equities, as measured by the STOXX 600, also violated its 50 dma, though its uptrend remains intact.
(click to enlarge)
What's more, downtrending long Treasury bond yields have decisively broken technical support, which is bond price bullish and stock price bearish.
(click to enlarge)

Earnings preseason weak
To add fuel to the bear case, Thomson-Reuters reported that the earnings preseason is coming in on the weak side, though results are very preliminary (emphasis added):Looking at the companies that report before Alcoa, in the earnings preseason, the news isn’t much better. Only 52% of the companies that have reported so far have exceeded analyst earnings estimates, which is well below average. Historically, when fewer companies than average beat estimates, the trend continues throughout the full earnings season, and vice versa. Although the last two quarters have been exceptions, the current 52% beat rate is the lowest since the Q4 2010 preseason, as seen below in Exhibit 1.
Exhibit 1. SP 500: Earnings Estimate Beat Rates—Preseason and Full Season
(click to enlarge)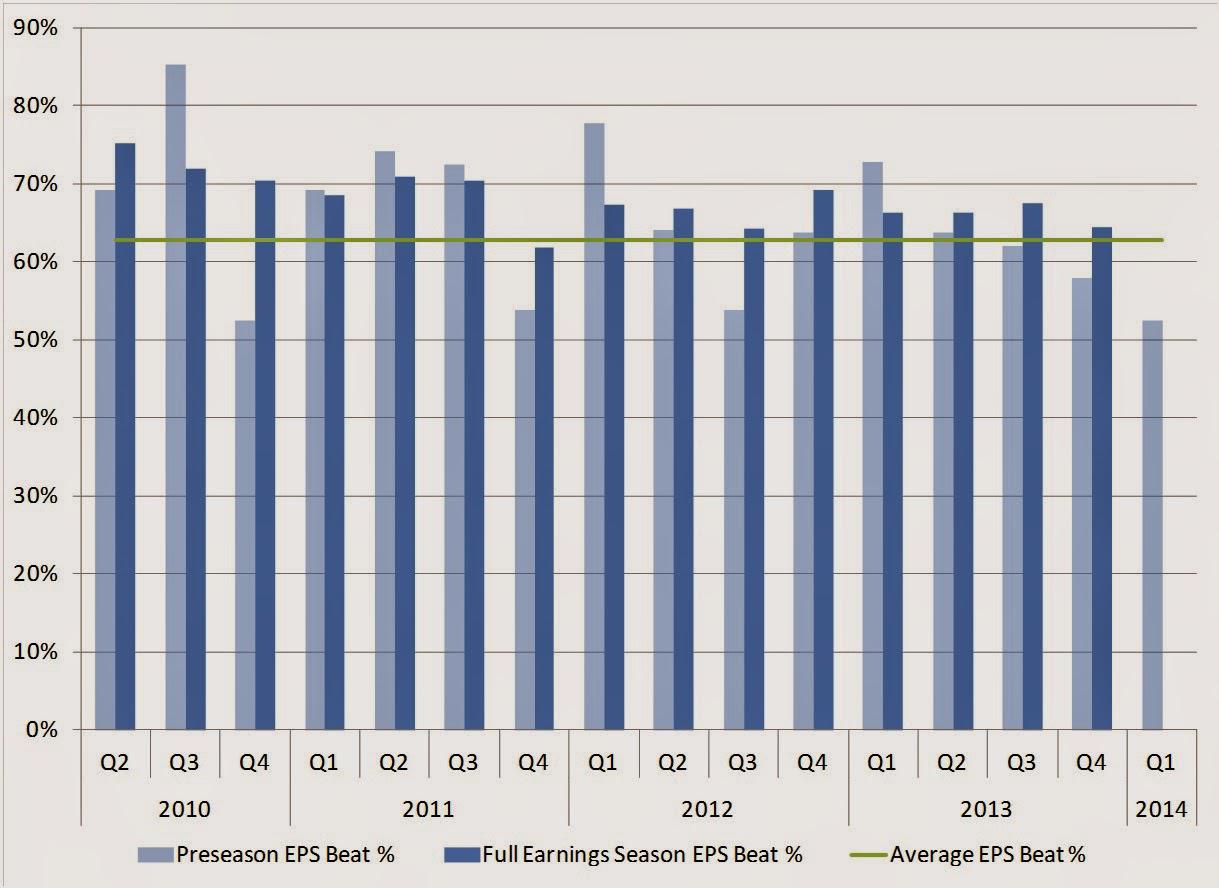
They concluded:
First-quarter earnings have gotten off to a slow start. While it is still too early to draw any firm conclusions, history suggests that we may not see the high percentages of companies beating estimates that we have seen over the past several quarters. Although earnings expectations are very low, factors like poor weather throughout the quarter and a promotional retail environment may make it difficult for companies to surprise analysts as they have in the past.A typical mid-term election year?
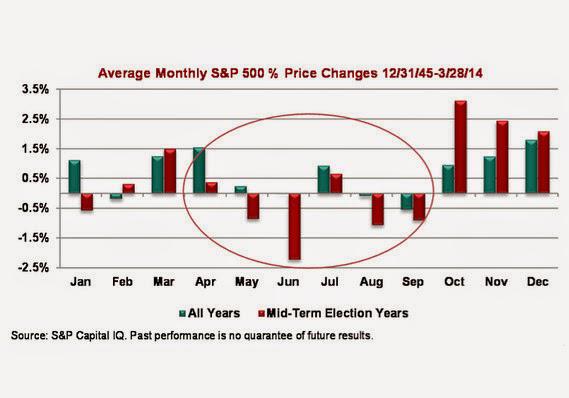
My best explanation for the equity market weakness is that this is a typical case of a mid-term election year swoon. Sam Stovall analyzed past market patterns in mid-term election years and found that the May to September period was especially weak. The silver lining is that the end of Q3 and the start of Q4 presents a great buying opportunity if this market follows the historical pattern:
In the second year of a presidential cycle, the average first-quarter gain in the SP 500 has been 1.2%, according to Stovall. This year has been no different; the SP 500 is up about 1.3% for the quarter. The problem is that midterm years during the second year of the presidential cycle tend to have lousy second quarters, with an average drop of 2.5%. The third quarter is somewhat less lousy, averaging a 0.3% decline.
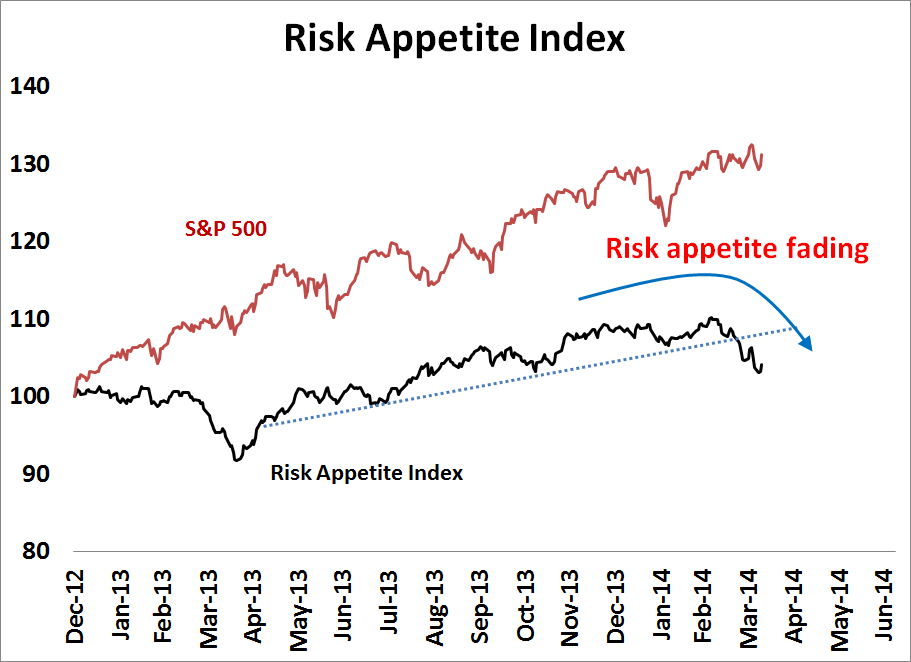
Risk aversion is falling
Market
psychology is definitely shifting. In my last post, I had constructed
an equity-based risk appetite index and showed that it was rolling over
(see Bears 2 Bulls 1):(click to enlarge)
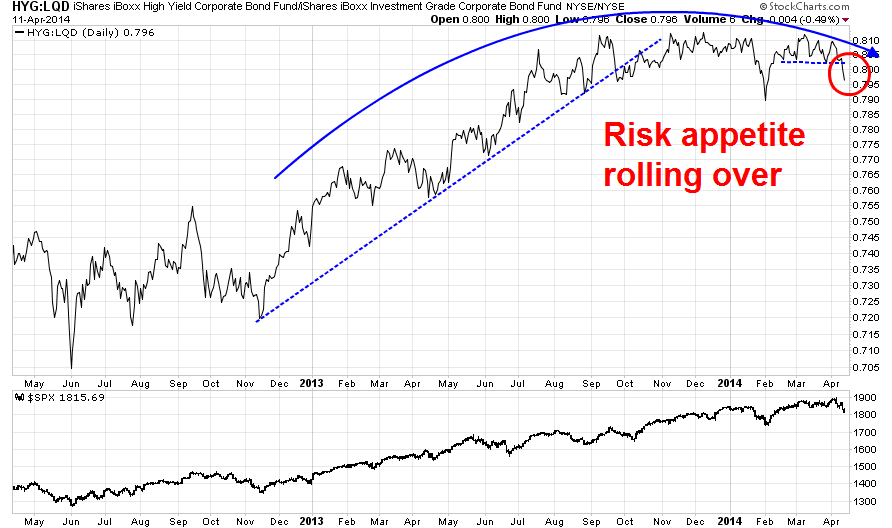
Other non-equity based measures of risk appetite are showing a similar pattern of decline. Here is the relative performance of US junk bonds against investment grade corporate bonds:
(click to enlarge)
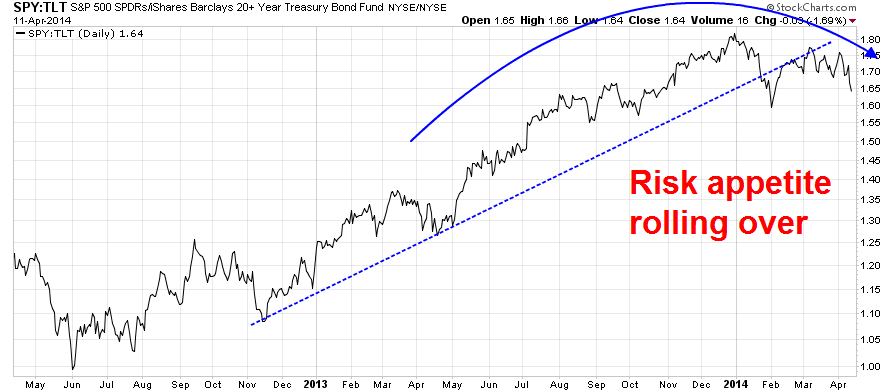
Here is the relative performance of stocks (SPY) against long Treasuries (TLT), which shows a similar picture:
(click to enlarge)
The relative performance of the high-beta small cap Russell 2000 against the SPX has broken relative support:
(click to enlarge)

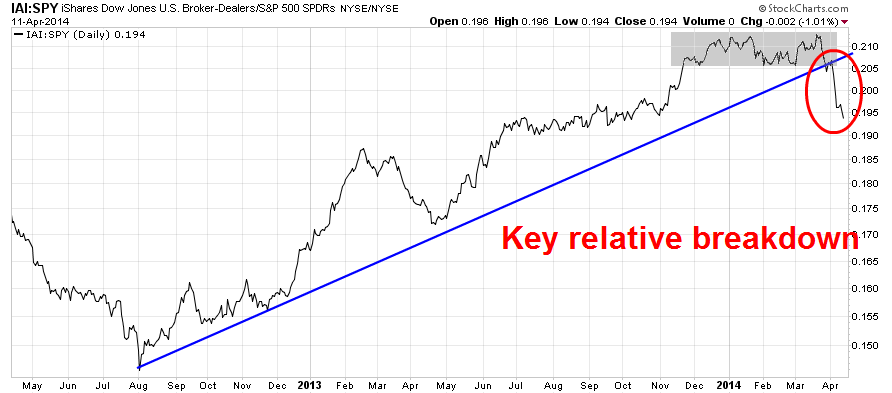
Groups that should lead the market up if this was a bull phase, such as the broker-dealers, are also turning down. The relative performance chart of the broker-dealer ETF (IAI) to SPY below shows both the breach of a relative uptrend and a breakdown from a relative consolidation range (shown in grey):
(click to enlarge)
I could go on, but you get the idea. When I put all of these observations together, it suggests that we have seen the Spring highs in stocks and the next few months will be difficult for equity investors.
Sell everything ASAP?
Does
that mean that you should sell everything right at the open on Monday
morning? Not quite. Nothing goes up or down in a straight line and the
stock market is getting oversold. Bearish sentiment is getting a little
overdone in the short term and stock prices are poised for a
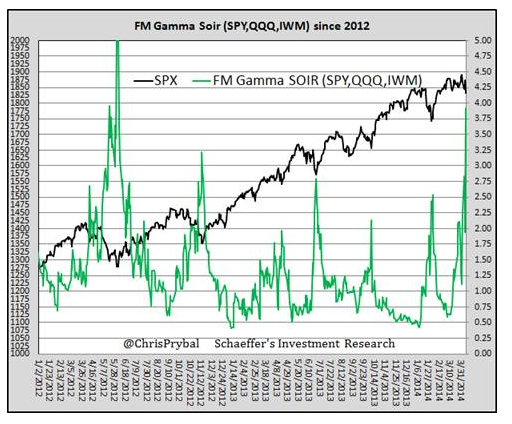
counter-trend rally at any time.As an example, Ryan Detrick wrote, "Our proprietary front month gamma weighted p/c ratio is scared to death." For newbies, the put/call ratio is a contrarian sentiment indicator and excessive put protection buying is contrarian bullish.
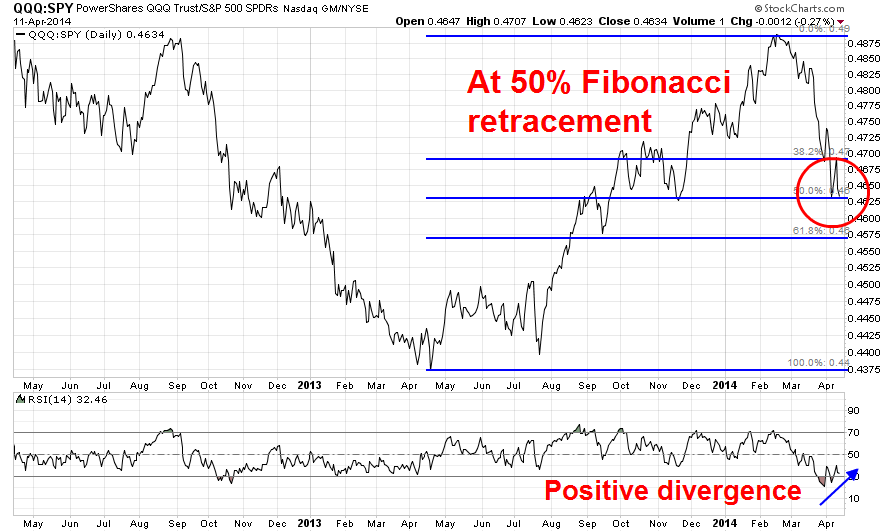
I am seeing other indications that the most vulnerable groups could be due for a bounce. As an example, the relative performance of QQQ against SPY shows that the relative decline of the pair is now sitting at about the 50% retracement of the relative up move that began about a year ago. As well, it is showing a positive divergence on the 14 day RSI, which indicates the loss of selling momentum. These are are signs that if the panic selling were to pause and a relief rally were to occur, this would be the ideal spot.
(click to enlarge)
In addition, the poster child for panic selling, the NASDAQ Composite, formed an inverted hammer on Friday just as it tested a major support level at 4000:
(click to enlarge)
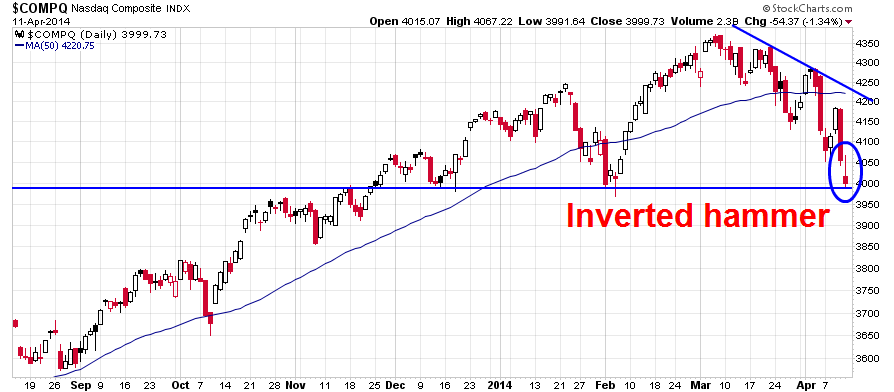
The inverted hammer candlestick is a sign of trend reversal, especially if it appears near critical turning point levels, such as technical support.
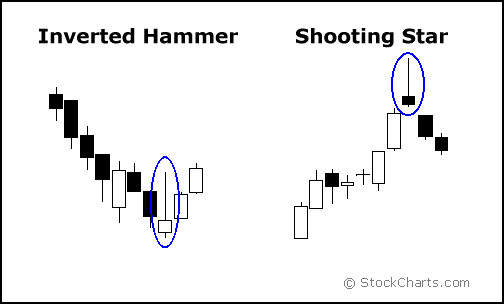
The Candlestick Trading Forum explains it this way:
The Inverted Hammer is comprised of one candle. It is easily identified by the small body with a shadow at least two times greater than the body. Found at the bottom of a downtrend, this shows evidence that the bulls are stepping in, but the selling is still going on. The color of the small body is not important but the white body has more bullish indications than a black body. A positive day is required the following day to confirm this signal.Given the events in eastern Ukraine over the weekend, a rally on Monday to confirm the inverted hammer could be a challenge. However, we do have a blood moon eclipse, which could mark the high tide of bearishness, and Turnaround Tuesday to look forward to.
Should the NASDAQ Composite stage a relief rally, an examination of the COMPQ chart shows that the bear case can remain intact even if the index rises to the pictured downtrend line, which is also roughly the level of the 50 dma. The distance from Friday's close to the aforementioned targets at the 4220-4230 level, this represents potential upside of about 5%, which is beyond the threshold of many short-term traders.
Sell on strength
In
summary, it appears that the intermediate term trend for stock prices
is down. It would not be unusual at all to see a mid-term election year
correction of 10-20% on a peak-to-trough basis. After which, equities
typically present a great buying opportunity into 2015.I would caution, however, the market is short-term oversold so don`t be overly eager to get short the high flyers. You could get your face ripped off by a counter-trend rally.
My inner investor is preparing himself to raise some cash on strength and my inner trader is preparing himself to get short this market should prices rise as anticipated.
Cam Hui is a portfolio manager at Qwest Investment Fund Management Ltd. (“Qwest”). The opinions and any recommendations expressed in the blog are those of the author and do not reflect the opinions and recommendations of Qwest. Qwest reviews Mr. Hui’s blog to ensure it is connected with Mr. Hui’s obligation to deal fairly, honestly and in good faith with the blog’s readers.”
None of the information or opinions expressed in this blog constitutes a solicitation for the purchase or sale of any security or other instrument. Nothing in this blog constitutes investment advice and any recommendations that may be contained herein have not been based upon a consideration of the investment objectives, financial situation or particular needs of any specific recipient. Any purchase or sale activity in any securities or other instrument should be based upon your own analysis and conclusions. Past performance is not indicative of future results. Either Qwest or I may hold or control long or short positions in the securities or instruments mentioned.