股指期货组合策略 | |||||||||||||||||||||||||||
股指期货组合策略 - 介绍总所周知,股指期货市场里头有三大参与者;套利者,套保者以及投机者。但是,这几年里,全世界股指期货市场里头出现了新的一类型参与者。这个参与者用数学,策略以及智慧来取得简单投机所取得不了的收益但又减低了投资风险。这类人介于投机者以及套保者之间,叫做组合策略者(Spreader)。这类型参与者应用不同股指期货合约的组合性策略(Futures Spreads)来减低投资风险又为股指期货投资行为增加盈利渠道。甚至沪深300横向时也能快速在一天的盘中赚钱!这种策略也称之为“价差交易”,也有专家称之为“套利”,当然,组合策略的目的以及方法跟无风险套利还是有区别的,所以我倾向于用“组合策略”这个名称。 那么,股指期货组合性策略是什么?它为什么这么神奇?它的工作原理又是什么? 期货组合策略是什么?期货组合策略是通过把不同交割期或者标的物的期货合约同时多空开仓来形成的期货投资组合。比如说,当你做多近月份股指期货合约并且同时做空远月份股指期货合约的时候,你已经是在执行一种股指期货组合策略。其实股指期货套利以及套期保值所用的方法也是一种期货组合策略其最大的分别是在于目的而不是方法。期货组合策略的目的有很多,最为广泛应用而且方法种类最多的是在大宗商品期货市场里头。在大宗商品期货市场里头,期货组合策略能大概分为三大类;跨期,跨品种以及跨市。其方法又分为看涨组合,看跌组合以及蝴蝶组合。我们将在下面具体地介绍。 为什么要用期货组合策略?在学习各种期货组合策略以及沪深300股指期货市场能用的组合策略之前,我们先来看看期货组合策略到底有什么值得学习应用的理由。期货组合策略主要功能在于增加盈利渠道以及减低期货投资风险这两方面。 增加盈利渠道 当你直接做多还是做空股指期货合约的时候,你只有在沪深300依照你所预测的方向发展的时候才有可能赚钱,也就是说只有一种赚钱的可能。但是当你用期货组合策略时,赚钱的可能却增加到五种! (一) 当多手升,空手跌 (二)当多手升,空手保持未动 (三)当多手升得多,空手升得少 (四)当空手跌得多,多手跌得少 (五)当空手跌,多手保持未动 由此可见,期货组合策略所投的并非标的物的绝对方向而是两个不同的期货合约之间价格的变化!这就是我刚才说的目的性不同于套利和套保。 减低风险 总所周知,期货投机是一种无限风险的投资行为。简单地说,当你做多股指期货的时候,你所开仓的合约将会随着沪深300的下跌而不断地亏损直到爆仓。相同地,当你做空股指期货时,该合约也会随着沪深300的上升而不断亏损。这就是无限风险。期货组合策略不但因为组合内的期货合约有对冲性而变成有限风险,期货组合策略所需要的保证金在某些市场里头远远地比直接交易的保证金低。是的,因为保证金低了,投资回报率就高了,形成了期货组合策略的低风险,高回报特性。 期货组合策略另外一个减低风险的因素在于期货组合策略投的是期货合约之间价格差距的变化。这个变化一般上有限度也有季节性,使得投资期货组合策略的可预测性比直接开仓投机于标的物的价格变化来得高多了。 期货组合策略种类大致上期货组合策略能分为三大类;跨期,跨品种以及跨市。方法又分为看涨组合,看跌组合以及蝴蝶组合。 跨期组合策略 跨期组合策略,Intramarket Spreads, 是以相同标的物的不同交割期合约组合而成的。这个是最基本的期货组合策略方法,其做法与套保以及套利很相似。跨期组合策略的重点在与两个不同期货合约之间的价差以及价格变化的不同。因为两个期货合约之间的价差是有季节性以及限度的,所以在价差到达限度的顶部时可以通过看跌组合来盈利,在价差到达底部时可以通过看涨组合盈利。这远远比预测标的物的价格趋向来得简单而且也能在标的物价格横向时也能赚钱。目前我们中国股指期货能够使用的期货组合策略就只有跨期组合策略。 接着学习股指期货跨期组合策略 跨品种组合策略 跨品种组合策略, Intermarket Spreads, 是以不同但是相关的标的物期货合约组合成的。这种期货组合策略一般上应用于大宗商品期货市场里头。它基本上是做多一种商品的期货同时做空另外一种商品的期货合约。这两种商品必须是有一定关系的,一般上是原材料以及其加工成品。国际上最常应用的是黄豆以及黄豆成品的组合以及原油以及汽油的组合。这种组合帮助原材料加工商锁定原料以及成品价之间的价格空间。如果没有这样的组合策略,加工商就会因为原材料价格暴涨还是成品价格下跌(或者双方面的因素)而使得加工入不敷出。另外一种常用的跨品种组合就是以价格上有季节关系的商品组合起来,比如黄金以及白银。以一种商品的涨价来抵消另一种商品的降价。 跨市组合策略 跨市组合策略, Interexchange Spreads, 是在不同期货市场里头套同样标的物的相同期货合约的价差。在国外,同样的期货合约可能在多过一个交易所或市场里头交易。有一些像日经指数期货的大股指期货合约甚至在不同国家在做交易。这样的话,因为不同市场里头的买卖因素,同样的期货合约可能就会在不同市场里头有一些价格上的差距。这种也算是一种套利方法。 看涨组合 看涨组合,Bull Spread, 是用来在两个期货合约之间的价差缩小时盈利。两个期货合约之间的价差一般上在标的物上涨的时候缩小,因此被名为看涨组合。但是看涨组合重点是在期货合约之间的价差缩小,因为看涨组合也在多标的物的跨产品组合策略中应用。看涨组合的做法一般上是做多近月份然后做空远月份期货合约。 看跌组合 看跌组合, Bear Spread, 是用来在两个期货合约之间的价差变大时盈利。两个期货合约之间的价差一般上在标的物下跌的时候加大,因此被名为看跌组合。但是看跌组合重点是在期货合约之间的价差加大,因为看跌组合也在多标的物的跨产品组合策略中应用。看跌组合的做法一般上是做空近月份然后做多远月份期货合约。
|
Friday, February 22, 2013
Wednesday, February 20, 2013
Visualizing Bob Farrell's 10 Rules
Visualizing Bob Farrell's 10 Rules
Disclosure: I have no positions in any stocks mentioned, and no plans to initiate any positions within the next 72 hours.
As the markets once again approach historic highs, the overly exuberant tone, extreme complacency and weakness in the economic data bring to mind Bob Farrell's 10 investment rules which should be a staple for any long-term successful investor. Bob Farrell is a Wall Street veteran with over 50 years of experience in crafting his investing rules. Farrell obtained his masters degree from Columbia Business School and started as a technical analyst at Merrill Lynch in 1957. Even though Farrell studied fundamental analysis under Gramm and Dodd, he turned to technical analysis after realizing there was more to stock prices than balance sheets and income statements. Farrell became a pioneer in sentiment studies and market psychology. His 10 rules on investing stem from personal experience with dull markets, bull markets, bear markets, crashes and bubbles. In short, Farrell has seen it all and lived to tell about it.
The 10 Rules Of Investing
1. Markets tend to return to the mean (average price) over time.
Like a rubber band that has been stretched too far - it must be relaxed in order to be stretched again. This is exactly the same for stock prices which are anchored to their moving averages. Trends that get overextended in one direction, or another, always return to their long-term average. Even during a strong uptrend or strong downtrend, prices often move back (revert) to a long-term moving average. The chart below shows the S&P 500 (SPY) with a 52-week simple moving average.
(click to enlarge)
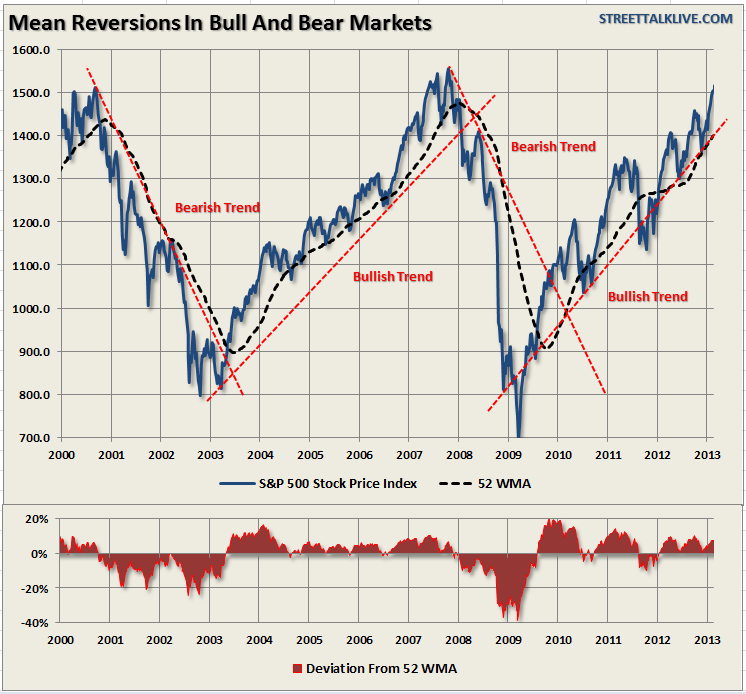
The bottom chart shows the percentage deviation of the current price of the market from the 52-week moving average. During bullish trending markets there are regular reversions to the mean which create buying opportunities. However, what is often not stated is that in order to take advantage of such buying opportunities profits should have been taken out of portfolios as deviations from the mean reached historical extremes. Conversely, in bearish trending markets, such reversions from extreme deviations should be used to sell stocks, raise cash and reduce portfolio risk rather than "panic sell" at market bottoms.
The dashed RED lines denote when the markets changed trends from positive to negative. This is the very essence of portfolio "risk" management.
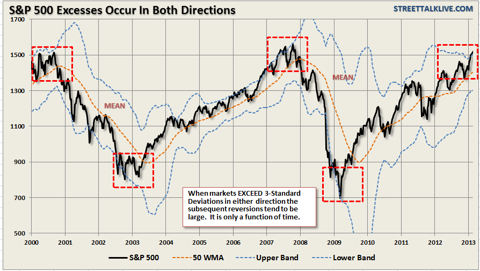
2. Excesses in one direction will lead to an opposite excess in the other direction.
Markets that overshoot on the upside will also overshoot on the downside, kind of like a pendulum. The further it swings to one side, the further it rebounds to the other side. This is the extension of Rule #1 as it applies to longer term market cycles (cyclical markets).
While the chart above showed prices behave on a short-term basis - on a longer term basis markets also respond to Newton's 3rd law of motion:"For every action there is an equal and opposite reaction." The first chart shows that cyclical markets reach extremes when more than 3-standard deviations are above the 50-week moving average. For the first time since the lows of the market in 2009 this has now occurred. Notice that these excesses ARE NEVER worked off by just going sideways.
(click to enlarge)
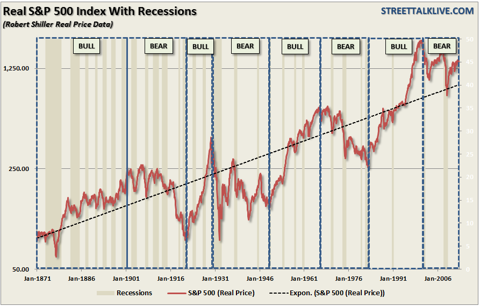
The second chart shows the price reversions of the S&P 500 on a long-term basis and adjusted for inflation. Notice that when prices have historically reached extremes - the reversion in price is just as extreme. It is clear that the current reversion in the stock market is still underway from the 2000 peak.
(click to enlarge)
3. There are no new eras - excesses are never permanent.
There will always be some "new thing" that elicits speculative interest. These "new things" throughout history, like the "Siren's Song," has led many investors to their demise. In fact, over the last 500 years we have seen speculative bubbles involving everything from Tulip Bulbs to Railways, Real Estate to Technology, Emerging Markets (5 times) to Automobiles and Commodities. It always starts the same and ends with the uttering of "This time it is different"
[The chart below is from my March 2008 seminar discussing that the next recessionary bear market was about to occur.]
(click to enlarge)

As legendary investor Jesse Livermore once stated:
"A lesson I learned early is that there is nothing new in Wall Street. There can't be because speculation is as old as the hills. Whatever happens in the stock market today has happened before and will happen again."
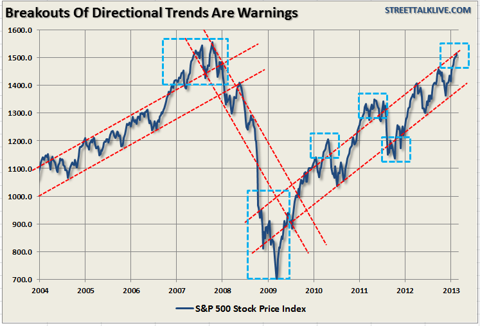
4. Exponential rapidly rising or falling markets usually go further than you think, but they do not correct by going sideways
The reality is that excesses, such as we are seeing in the market now, can indeed go much further than logic would dictate. However, these excesses, as stated above, are never worked off simply by trading sideways. Corrections are always just as brutal as the advances were exhilarating. As the chart below shows when the markets broke out of their directional trends - the corrections came soon thereafter.
(click to enlarge)
5. The public buys the most at the top and the least at the bottom.
The average individual investor is most bullish at market tops and most bearish at market bottoms. This is due to investor's emotional biases of "greed" when markets are rising and "fear" when markets are falling. Logic would dictate that the best time to invest is after a massive selloff - unfortunately this is exactly the opposite of what investors do.
The chart below shows the flow of money into equity based mutual funds.
(click to enlarge)

6. Fear and greed are stronger than long-term resolve.
As stated in Rule $5 it is emotions that cloud your decisions and affect your long-term plan.
"Gains make us exuberant; they enhance well-being and promote optimism," says Santa Clara University finance professor Meir Statman. His studies of investor behavior show that "Losses bring sadness, disgust, fear, regret. Fear increases the sense of risk and some react by shunning stocks."
The composite index of bullish sentiment (an average of AAII and Investor's Intelligence surveys) shows that "greed" is beginning to reach levels where markets have generally reached intermediate term peaks.
(click to enlarge)
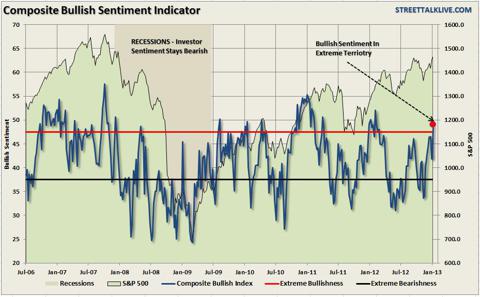
In the words of Warren Buffett:
"Buy when people are fearful and sell when they are greedy."
Currently, those "people" are getting extremely greedy.
7. Markets are strongest when they are broad and weakest when they narrow to a handful of blue-chip names.
Breadth is important. A rally on narrow breadth indicates limited participation and the chances of failure are above average. The market cannot continue to rally with just a few large-caps (generals) leading the way. Small and mid-caps (troops) must also be on board to give the rally credibility. A rally that "lifts all boats" indicates far-reaching strength and increases the chances of further gains.
(click to enlarge)
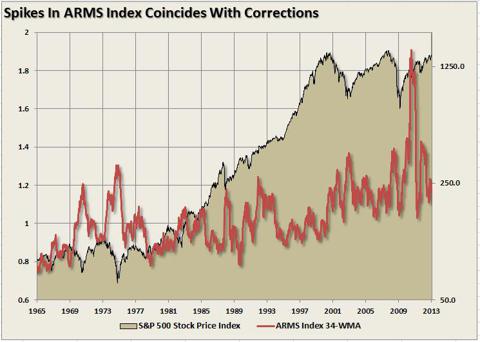
The chart above shows the ARMS Index which is a volume-based indicator that determines market strength and breadth by analyzing the relationship between advancing and declining issues and their respective volume. It is normally used as a short-term trading measure of market strength. However, for longer term periods the chart shows a weekly index smoothed with a 34-week average. Spikes in the index has generally coincided with near-term market peaks.
8. Bear markets have three stages - sharp down, reflexive rebound and a drawn-out fundamental downtrend
Bear markets often start with a sharp and swift decline. After this decline, there is an oversold bounce that retraces a portion of that decline. The longer term decline then continues, at a slower and more grinding pace, as the fundamentals deteriorate. Dow Theory suggests that bear markets consists of three down legs with reflexive rebounds in between.
(click to enlarge)

The chart above shows the stages of the last two primary cyclical bear markets. There were plenty of opportunities to sell into counter-trend rallies during the decline and reduce risk exposure.
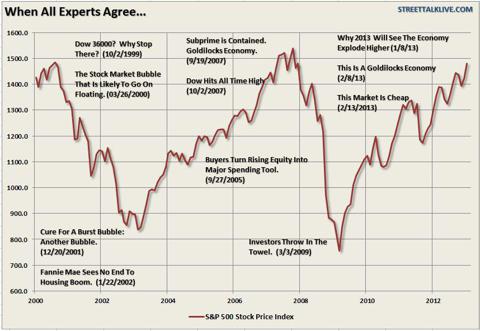
9. When all the experts and forecasts agree - something else is going to happen.
This rule fits within Bob Farrell's contrarian nature. As Sam Stovall, the investment strategist for Standard & Poor's once stated:
"If everybody's optimistic, who is left to buy? If everybody's pessimistic, who's left to sell?"
The point here is that as a contrarian investor, and along with several of the points already made within Farrell's rule set, excesses are built by everyone being on the same side of the trade. Ultimately, when the shift in sentiment occurs - the reversion is exacerbated by the stampede going in the opposite direction
(click to enlarge)
Being a contrarian can be quite difficult at times as bullishness abounds. However, it is also the secret to limiting losses and achieving long-term investment success. As Howard Marks once stated:
"Resisting - and thereby achieving success as a contrarian - isn't easy. Things combine to make it difficult; including natural herd tendencies and the pain imposed by being out of step, since momentum invariably makes pro-cyclical actions look correct for a while. (That's why it's essential to remember that "being too far ahead of your time is indistinguishable from being wrong.")Given the uncertain nature of the future, and thus the difficulty of being confident your position is the right one - especially as price moves against you - it's challenging to be a lonely contrarian."
10. Bull markets are more fun than bear markets
As stated above in Rule #5 - investors are primarily driven by emotions. As the overall markets rise - up to 90% of any individual stock's price movement is dictated by the overall direction of the market hence the saying "a rising tide lifts all boats."
Psychologically, as the markets rise, investors begin to believe that they are "smart" because their portfolio is going up. In reality, it is primarily more a function of "luck" rather than "intelligence" that is driving their portfolio.
Investors behave much the same way as individuals who are addicted to gambling. When they are winning they believe that their success is based on their skill. However, when they began to lose, they keep gambling thinking the next "hand" will be the one that gets them back on track. Eventually - they leave the table broke.
(click to enlarge)
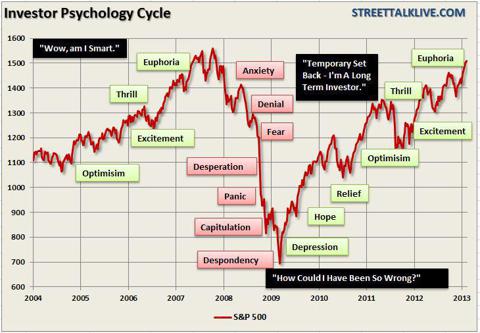
It is true that bull markets are more fun than bear markets. Bull markets elicit euphoria and feelings of psychological superiority. Bear markets bring fear, panic and depression.
What is interesting is that no matter how many times we continually repeat these "cycles" - as emotional human beings we always "hope"that somehow this "time will be different." Unfortunately, it never is and this time won't be either. The only questions are: when will the next bear market begin and will you be prepared for it?
Conclusions
Like all rules on Wall Street, Bob Farrell's rules are not meant as hard and fast rules. There are always exceptions to every rule and while history never repeats exactly it does often "rhyme" very closely.
Nevertheless, these rules will benefit investors by helping them to look beyond the emotions and the headlines. Being aware of sentiment can prevent selling near the bottom and buying near the top, which often goes against our instincts.
Regardless of how many times I discuss these issues, quote successful investors, or warn of the dangers - the response from both individuals and investment professionals is always the same.
"I am a long term, fundamental value, investor. So these rules don't really apply to me."
No you're not. Yes, they do.
Individuals are long-term investors only as long as the markets are rising. Despite endless warnings, repeated suggestions and outright recommendations - getting investors to sell, take profits and manage your portfolio risks is nearly a lost cause as long as the markets are rising. Unfortunately, by the time the fear, desperation or panic stages are reached it is far too late to act and I will only be able to say that I warned you.
Thursday, February 14, 2013
Why Solar ETFs Are Rallying
Solar exchange traded funds are expected to perform better this year as policymakers have found some resolution for the U.S. fiscal cliff and industry consolidation and investment takes place. The industry is evolving and is slowly finding ways to reduce costs while increasing efficiency.
"Recent concerns about high fossil-fuel prices, global warming, and a questionable ability to meet growing long-term electricity demand have galvanized widespread interest in the renewable energy industry. Throw in government tax subsidies for electricity production and alternative energy implementation, strong global demand, and state-mandated renewable portfolio standards in the United States, and the near future has the potential to be prosperous times for alternative energy producers and developers alike," Abraham Bailin wrote for Morningstar.
The global solar industry got burned in 2012, however, this year focused ETFs have performed well and are forecast to provide strong gains this year. The Guggenheim Solar ETF (TAN) gained 13.5% so far, while theMarket Vectors Solar Energy ETF (KWT) has gained 11.6% year-to-date.
It appears that China is leading the path in the growth of the solar energy industry. The recent decline in the cost of developing solar technologies will help boost growth in the solar sector in China and other untapped markets, reports Zacks Equity Research. Also, China is putting another $1.1 billion in subsidies to the sector, double of what the government has already put in. In turn, the Chinese solar export market should heat up again, after being left with excess capacity and low demand.
Furthermore, solar projects are up and running in the Middle East, with about $6.8 billion invested into projects in countries such as UAE, Kuwait, Egypt, Jordan and even Morocco.
President Obama is also expected to help drive the performance of the solar power industry. He has been a long time supporter of alternative and solar power , and is expected to push alternative energy sources hard during his second term.
Lastly, the possible takeover of First Solar (FSLR) has been a boon for the sector as share prices for the stock are up 5.8%, reports Benzinga. First Solar is the largest U.S. solar power company, and rumors that General Electric (GE) has the company in its sights has bode well for the industry. TAN gives 8.74% to FSLR while KWT allocates 8.14% of assets to the stock.
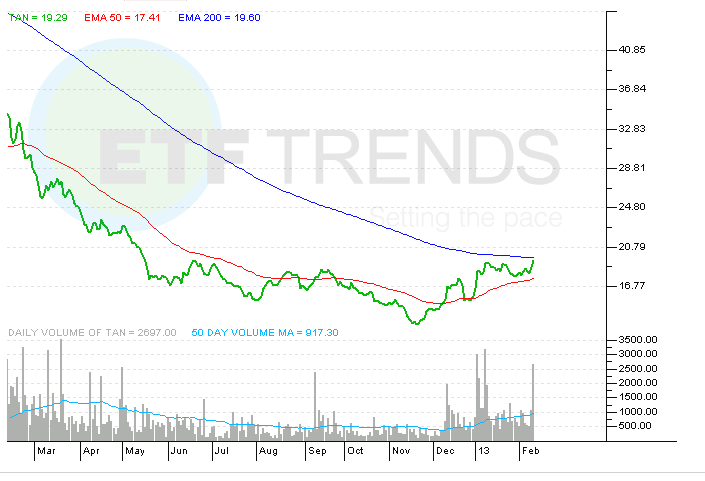
Guggenheim Solar ETF
(click to enlarge)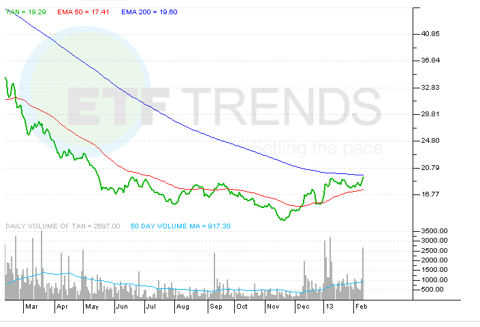
Tisha Guerrero contributed to this article.
Tuesday, February 5, 2013
发展长沙现代金融为支柱产业 “人才金港”打造第一生产力
| 发展长沙现代金融为支柱产业 “人才金港”打造第一生产力 |
http://news.changsha.cn | 2012-08-31 18:16:23 星辰在线 | 复制链接  |
订湘江手机报,大事趣事绝不漏掉。编辑短信XJ,移动用户发送至10086,联通、电信用户发送至1062892211,3元/月。
星辰在线—长沙新闻网8月31日讯(记者 岳珊)总行程一万公里,三方专家38场专题调研,十几万字的调研报告,一个关于长沙未来金融业发展的决议……从长沙市人大第十三届人大常委会第四十二次会议上通过《关于加快发展我市现代金融业专题调研报告》的那一刻起,长沙未来金融业正朝着“三个比重”、“一二三快速发展工程”、“一主、一副、一区、一园”的目标大步迈进。
在人类数千年的物质文明中,金融是巨功至伟,常常形象比如经济的命脉,是现代经济体系中的核心地位,谁拥有了强大的金融,谁将掌握金融资源的控制权,进而取得经济发展的主动权和话语权。近7年来,长沙市的经济分别在九五,十五,十一五连续赶超了两个、三个、五个省会城市,经济总量挤进省会城市前7强,而经济的发展未能获得同步,与经济发展没有呈现出正相关的走势。市人大副主任王国海告诉记者,“金融业作为一个不断创造财富神话的朝阳产业,也是典型的两型产业,将是支持长沙经济发展的新的引擎。希望在市委的正确领导下,用10 年左右时间把长沙金融业打造成支柱产业。同时呈现出金融市场体系完善,金融聚集度高,金融产品丰富,金融生态环境优良,特色金融效益明显,金融辐射效果到位,金融贡献度不断提升的金融新格局。”
金融是推动经济发展的“发动机”,发展现代金融业,人才是第一生产力。金融业的竞争从本质上讲更是金融人才的竞争。长沙金融人才的问题归纳总结就是两大问题,即人才“数量”和“质量”的问题。毫无疑问,人才已经成为制约长沙金融业发展壮大的主要瓶颈之一。
“加大力度建设金融人才队伍,对加快发展现代金融业有着事半功倍的效果。汇集懂金融的政府领导人才、金融领军人才(金领)、金融骨干人才等三类金融人才,引领长沙现代金融业的发展。”湖南大学两型社会研究院院长、教授、博士生导师乔海曙参与了此次金融业发展的调研全省,并针对长沙金融业的发展提出了自己的建议,“一是模仿上海、广州等金融发达城市的经验,政府一把手亲自管金融,二是政府班子成员中,要配备精通现代金融业的领导。建立金融人才双向交流机制,提供更多的机会,让金融英才走进领导班子。针对金融领军人才,尽快出台一些吸引高端金融人才的优惠政策,包括对金融高管个人所得税部分返还,对其子女就读等提供一定的便利,为这些金领人才创造一个好的工作生活环境。针对金融骨干人才,建议尽快建设长沙的“人才金港”,为金融业发展提供稳定的人才市场。”
要点解读:
“三个比重”—— 力争“十二五”期末,将金融业增加值占GDP的比重提高到4.5%左右,直接融资比重达25%,地方金融资产占金融机构总资产的比重达到35%左右,“十三五”期末分别达到6%、35%和50%左右。
“一二三快速发展工程”—— “一”是打造一个资产规模超千亿元的龙头企业,“二”是打造二个资产规模超5000亿元的精品企业,“三”是打造三个资产规模超1000亿元的骨干企业。“一个万亿”:支持长沙银行尽快上市,力争在2021年资产超万亿元;“两个五千亿”:组建长沙农村商业银行和支持华融湘江银行加快整合扩张,力争在2020年资产超5000亿元;“三个过千亿”:强力支持证券、保险、信托和风投创投机构的本土企业发展,力争在2020年培育三个资产规模过千亿元的企业。
“一主、一副、一区、一园”—— 一主(芙蓉中路金融街)、一副(沿江金融集聚带)、一区(金融后台园区)、一园(科技与金融结合的创新园)。加快基础设施和软硬件配套设施建设,大力引进国内外各类金融机构入驻,提高长沙金融产业的核心竞争力。
Monday, February 4, 2013
6 ETFs That Led The Stock Market In January
6 ETFs That Led The Stock Market In January
Posted 02/01/2013 08:05 AM ET
The New Year ushered in a new crop of stock market leaders. Here's a look at six nonleveraged ETFs that outperformed the stock market the most in January.
What they all seem to have in common is that they lagged the market in 2011, followed by mixed returns last year. So they could be catch-up or reversion-to-the-mean plays, in which stocks that snoozed as the market leapt eventually join the leaders. Sector and country rotation occurs as successful investors sell their winners on the belief that they're overvalued and buy undervalued losers.
Victory In Vietnam

Getty View Enlarged Image
Market Vectors Vietnam ETF (VNM) vaulted 19% in January. IShares MSCI Emerging Markets Index (EEM) ticked down 0.3%. The No. 1 performing ETF of the month has rallied 36% in the past year vs. 8% for EEM.
Vietnam staged a turnaround after crashing 44% in 2011. The economy slowed that year while inflation spiked 23% and the trade deficit widened, Neena Mishra, ETF research director at Zacks Investment Research wrote in a commentary.
"As a result, the government passed a resolution to restrain credit growth and control inflation and the central bank raised rates," Mishra wrote.
She continued: "Vietnam is expected to grow by almost 6% over the next 25 years and per capital income is expected to grow by more than six times over the same period. Vietnam continues to be the main beneficiary of the migration of low-end manufacturing out of China as the producers try to take advantage of wages that are about half of that in China. The shift in China's policy to focus more on domestic consumption will also benefit Vietnam as an outsourcing center.
"We may add that Vietnam now faces strong competition from neighbors like Bangladesh, Myanmar and Cambodia in low-cost manufacturing. However, in recent years the country has been somewhat successful in moving up the value chain by starting manufacture of higher-value products, in addition to its traditional export items of clothing and footwear.
"The economy still suffers from some structural problems like inefficient and wasteful public enterprises (which account for about 40% of output), an undercapitalized banking sector and a high trade deficit."
VNM sports the highest IBD Relative Strength Rating and IBD Accumulation/Distribution Ratings combination of 89 and A+. It has outpaced nearly 90% of the market the past 12 months and institutional investors are overwhelming sellers.
Solar Energy Shines
Guggenheim Solar (TAN) and Market Vectors Solar Energy ETF (KWT) heated up nearly 16% for the month vs. 5% for SPDR S&P 500 Index ETF (SPY). TAN and KWT have rocketed 35% the past three months vs. 7% for the SPY.
The solar industry's fortunes may be turning for the better after severely lagging the market the past four years because of over production in China coupled with cuts in crucial government subsidies in Europe and the U.S.
TAN and KWT crashed 29% in 2010, 64% in 2011 and 33% in 2012.
"2013 will mark a major shift for the solar industry as industry participants shrink, minimizing supply and pricing issues, and as geographic distribution improves," Todd Rosenbluth, an ETF analyst at S&P Capital IQ, said in an email. "We see this combination allowing for better fundamentals and prospects for survivors in 2014."
Most solar stocks are trading deep below book value, he adds. His top picks are Advanced Energy (AEIS), SunPower (SPWR) and Trina Solar (TSL). Each are weighted about 5% in TAN.
TAN's top three holdings are Hong Kong-based GCL-Poly Energy Holdings, weighted 12%; First Solar (FSLR) 8%; and MEMC Electronic Materials (WFR) 6%.
Brokers Break Out
IShares Dow Jones U.S. Broker-Dealers (IAI) notched a 13% gain in January. It's on the mend after lagging the stock market with a 27% nosedive in 2011 while the market gained 2%. It performed on par with the market last year. It started dominating three months ago, rising 22% vs. 7% for the SPY.
Wall Street powerhouses, Goldman Sachs (GS), Morgan Stanley (MS), NYSE Euronext (NYX), Charles Schwab (SCHW) and CME Group (CME) hold the heaviest weightings in the portfolio. They rose 7% to 20% in January.
Credit Suisse has an outperform rating on Goldman, Morgan Stanley and CME. It's neutral on NYSE and has no rating for Schwab.
IAI wins big and losses big in comparison to the market and is only appropriate as a small holding, says Timothy Strauts, an analyst at Morningstar.
He wrote in a report about the ETF: "While trading volumes help many of the firms in this portfolio generate transactional revenue, many of the firms in this ETF's portfolio also rely heavily on fees tied to assets under management. Thus, in rising markets, asset-based revenues tend to bolster performance. However, the significant operating leverage inherent with this type of business model cuts both ways.
"Profitability can get crushed during periods of declining revenues thanks to these firms' high level of fixed costs (that is, employee compensation and rent). Of course, the opposite is true during periods of strong market performance."
Oil And Gas Rev Up
Market Vectors Oil Services ETF (OIH) spouted 13% in January. It's gained only 5% the past 12 months, lagging SPY by nearly 11 percentage points. But it leads in the short term, rising 12% vs. 7% for SPY the past three months.
S&P Capital IQ rates the industry neutral over the next 12 months.
"While we still view the longer-term growth rate in upstream capital spending as a (long-term) positive, we harbor some concerns about near-term weakness outside of deepwater work," Rosenbluth wrote. "Our concerns stem in part from weakening global demand, even in emerging markets such as China; rising non-OPEC (Organization of Petroleum Exporting Countries) supply; and greater influence of the onshore U.S. market, where we see oil services demand as more volatile and beset by pressures from oversupply.
"On the other hand, the expected influx of new deepwater rigs through 2014 should spur demand for related services, and deepwater work typically carries higher margins."
Homebuilders Rebuilding
IShares Dow Jones U.S. Home Construction (ITB) stair-stepped up 11% in January. It developed an astonishing 77% return the past 12 months and 16% the past three months. It tumbled 9% in 2011 while SPY added 2%.
S&P Capital IQ forecasts housing starts to increase 27.1% to 991,500 in 2013, with multifamily developments outpacing single-family. But it has a negative outlook on homebuilders over next 12 months.
"We believe most publicly traded builders are in a stable competitive position after cutting costs, retiring debt and growing cash positions," Rosenbluth wrote. "However, we expect increased foreclosure activity in 2013 to pressure home prices and stall improvement in new single-family home sales.
"The housing market will improve over the next year, but be shy of consensus views for stronger growth. It will take time before buyers' confidence and the job market to improve enough to support a more favorable view of home ownership."
Housing starts are less than halfway to recovering their 30-year high of 2.07 million in 2005. They averaged 1.74 million a year from 2000 through 2004.
Here's a look at major housing data:
• December housing starts: Up 12% over November and up 37% year over year to a seasonally adjusted annual rate of 954,000.
• December single-family starts: Up 8.1% in December, with year-over-year growth of 18.5%.
• Full-year 2012 housing starts: Up 27.4%, to 780,000 (from 612,100 in 2011).
• December housing permits: Up 27.3% year-over-year for single-family homes. Up 35% for multi-family units, suggesting ongoing strength in rentals.
Follow Trang Ho on Twitter @TrangHoETFs.
Read More At IBD: http://news.investors.com/investing-etfs/020113-642809-industries-led-market-january-juice-left.htm#ixzz2Jwjj1Rq7
Subscribe to:
Posts (Atom)