In my last blog,
I wrote about my experience with building the SOFR curve. Now FINCAD F3
can handle any instrument market data for curve building. But at the
moment an important question is, “Which instruments are the right ones to use to build the SOFR curve?”
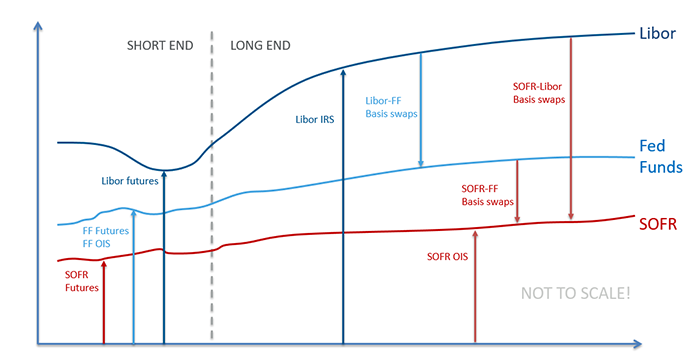
Right now, the market for SOFR-linked derivatives is just starting to
take shape, and market quotes are becoming available for CME SOFR
futures and SOFR swaps. There are three types of swaps that are being
traded: SOFR OIS, SOFR-FF basis swaps, and SOFR-Libor basis swaps. The
first one is an overnight indexed swap which pays SOFR versus fixed, and
the last two are basis swaps between SOFR and either the Fed Funds
effective rate (FF) or Libor.
The odd thing about introducing SOFR as an alternative benchmark
interest rate is that, for now, it makes the USD rate basis much more
complicated. This is because it adds two new basis spreads between
FF/SOFR and Libor/SOFR, in addition to the previous FF/Libor basis. So
now there are many possible ways to build the SOFR curve. These
include:
Single curve-building:
Use FF OIS to build the Fed Funds effective rate curve.
Use ED futures and Libor swaps to build the 3-month Libor curve.
Use SOFR futures and either SOFR OIS, FF/SOFR basis, or Libor/SOFR basis to build the SOFR curve.
Global curve-building:
Use ED futures, Libor swaps, FF OIS, FF/Libor basis swaps, SOFR
futures, and either SOFR OIS, FF/SOFR basis, or Libor/SOFR basis to
simultaneously build the 3-month Libor curve, Fed Funds effective rate
curve, and SOFR curve.
For many people, their instinct would be that building the
curves individually is the easiest. However, the dual dependence of the
FF OIS and FF/SOFR basis swaps on the OIS discount and SOFR curves
creates a curve construction problem, which necessitates a global
solver.
As mentioned in my previous post,
I chose to use the global method, because it is actually easier to just
let F3 automatically determine how to solve the curves from the
instruments selected. This approach also allows using the FF/Libor basis
for longer maturities, since often the Fed Funds OIS is not as liquid.
But there is still a big question here, “Which SOFR instruments should
we choose?”
Imagine swapping Fed Funds into Libor and then swapping Libor
exposure into SOFR. Now compare this with swapping Fed Funds into SOFR
directly. The question about the new SOFR basis is, “Does it roundtrip
so we get the same SOFR in both cases?” The answer right now is that
there is not enough trading on SOFR derivatives to closely round-trip
these two ways of swapping Fed Funds into SOFR. The symptom of SOFR
illiquidity is large bid-ask spreads in the market quotes for basis
swaps on SOFR, so that by using mid-quotes as market data, the SOFR
curve will look a little different in the two cases.
A recent summary of SOFR swap trading volumes
shows that there is a lot of uncertainty regarding where the volume
will show up in SOFR-linked derivatives. It is expected that they will
become traded more as time goes on, and competitive markets will result
in smaller bid-ask spreads. But we don’t know which swaps will be the
best to build the SOFR curve. Surely with Libor going away we shouldn’t
rely too much on Libor/SOFR basis swaps, but whether the future will
show volumes in the FF/SOFR basis or SOFR OIS is unknown. This is
another good reason to have a global curve-building solution which can
handle any and all instruments you throw at it. Such an approach will
help you react quickly to changes in trading volume in SOFR derivatives
to continue building the most accurate SOFR curve possible.
In case you missed it, you can check out my previous SOFR blog post here, “Building a SOFR Curve was Easy.” Also, be on the lookout for my next post, “Eliminating the SOFR Basis: What Do We Lose?”
About the author
Bin Hou
Senior Financial Engineer, FINCAD
Bin
is a member of the Financial Engineering Hub in Vancouver. Since he
joined FINCAD in 2013, Bin has made contributions to FINCAD products
through conducting model validations and encoding the best market
practice in examples and documents.
Bin holds a Master of Science in Finance degree from Simon Fraser University. He is also a CFA® and FRM® charterholder.
For which class of instruments the SABR/LIBOR Market Model does perform better than the classical LIBOR Market Model?
The LIBOR Market Model
The LIBOR Market Model — also known as Brace, Gatarek, Musiela model —
is an interest rate model capable of reproducing the correlation
structure of forward rates. One-factor models are unable to reproduce
this structure and therefore cannot price accurately derivatives whose
prices reflect these correlations. A typical example of such
derivatives are swaps paying a non-linear function of the difference two
swap rates for two different maturities.
The model is constructed by using a family of LIBOR rates: L0(t),…,Ln(t)
, where Li(t) is LIBOR forward rate starting at ti and ending at ti+1, following
dLi(t)=σi(t)Li(t)dWi+1(t).
The SABR LIBOR-Market Model
An important flaw of the LMM is known as sticky volatilities: if the model is calibrated in a highly volatile market it assumes that
this high volatility lasts forever, which leads to inaccurate results.
The SABR LMM attempts to address this issue. In this model, each LIBOR rate is assumed to follow a log-normal dynamic having stochastic volatility:
Tokenized Real Estate Lacks Features for Success.
Product-Market Fit Remains Deficient.
These Offerings Are Instructive in Seeking Better Offerings.
Tokenized real estate has long been discussed as a leading
use for digital securities. Yet, really no successful sales have taken
place. Some of the most notable and widely marketed projects were
pre-arranged to signal successful optics and had side deals to
incentivize investment. Though tokenized real estate will eventually
emerge, the benefits over existing financial offerings do not yet offer
the level of value needed to overcome market inertia and successfully
scale.
It’s no surprise that many real estate owners have an interest in
selling their property via a digital security fundraise. By
“fractionalizing,” breaking down investments into smaller pieces, real
estate sellers can ask for higher prices than they would selling
wholesale. Or alternatively, those that can not find buyers in
traditional markets turn to digital securities as a last resort à la
adverse selection.
Though this looks attractive to sellers, who would buy these
offerings? Consider the typical profile of a real estate investor -
conservative, interested in wealth preservation, sensitive to margin
costs. Generally, they do not want what most perceive to be experimental
investment technology. Furthermore, with the extant availability of
public REITs, fund managers, real estate crowdfunding,
and direct investments, the benefits of liquidity and access to foreign
inventory espoused by many security token evangelists are already
available. The short-term benefit to the investor is marginal at best
and comes with a high degree of perceived technology risk.
Ultimately, the real estate asset class suffers from the lack of high
upside to achieve product-market fit. A great real estate investment
for a passive investor might yield 20% a year. Why take all of this
perceived risk and adopt a new behavior when available investments can
offer similar returns without the unknowns? Due to adverse selection,
existing public and private market dynamics, and investor
characteristics, it’s hard to find a scenario by which both sides of the
transaction could find value meaningful enough to exceed the threshold
for adopting a new behavior.
The pool of digital security investors today is small and comprised
of, predominantly, blockchain/ICO-savvy investors. These people, still
nostalgic for their +1000% 2017 returns, have a high-risk tolerance,
want high-returns, and understand technology. They don’t want an 8%
fixed-income real estate debt product.
The primary exception to this may be those in countries with tight
capital controls (aka China), that want to expatriate their wealth into
stable, foreign assets. In this case, the primary benefit of security
token real estate, in short, is the ability to hide the movement of
capital from their government. I don’t know about you, but hiding cash
for the wealthy and circumventing national governments is not why I got
involved with blockchain.
Though real estate digital securities remain weak, their use-case
provides a helpful tool in exploring what a good investment would look
like. A “good” deal must benefit both parties in a transaction. The
product-market unfit of Real Estate and Security Tokens raises the
question of what, currently, a good deal would look like? What is the
ideal security token?
Ideally, digital security or not, the best investment has no risk and
infinite upside. Though such a perfect investment is unattainable,
features like downside risk protection (which can take many forms), a
known industry, and available liquidity can help to move an offering in
the right direction. At the same time, blockchain-based ownership needs
to offer some unique capability that necessitates a digital security
approach. This could take the form of high-complexity financial
structures, streamlined asset diligence, or blended “utility token”
benefits offering added value. This isn’t real estate.
Revenue streams backed by equity or a bond or other conversion
options may offer one strong example. In this case, a company may offer
investment into a new product-line or intellectual property asset and,
if the upside doesn’t manifest (as measured by some predetermined
milestone), offer conversion into company equity or other available
assets. If successful, the company could finance their CAPEX needs on
better terms and without diluting shareholders while investors could
gain exposure to high-upside in an otherwise unavailable investment.
Additional benefit could come in broadening company exposure or markets
via this fundraise as well.
For example, imagine an investment into the future revenues of a new
model of SpaceX rocket. The capital intensive requirements for creating
such a technology would typically lead to equity dilution and less
internal control of the business. In an STO raise, SpaceX could engage
the public, find financing on better terms, avoid dilution, and offer
high returns upon the successful commercialization of the product. In
the event of failed commercialization, investors could convert into the
equity of SpaceX at some pre-defined conversion ratio. Compared to the
compromises made via traditional means of financing, this approach could
make sense.
The market will surely mature. A blockchain-based security can
ultimately offer all the features of existing securities with additional
ones - reducing costs and increasing distribution. They are
fundamentally better. However, incremental benefit in an immature
market, like a real estate token, will not catalyze a seismic shift in
capital markets. The potential future benefits for portfolio managers of
real estate is clear, but how to jumpstart this marketplace remains murky. Real estate is just kinda boring.
Regulatory compliance is unavoidable and important, but those in the
industry (myself included) could gain from asking more often, what do
people actually want? The ICO world is imperfect, but the stodgy ethos
of STOs - middle-aged white men in blazers, their lawyers ever by their
side, talking in finance jargon about tranches of multi-asset EB5 blah
blah blah - could benefit from the creativity, boldness, and fun of the
crypto-craze that got us here.
--- The views and opinions expressed are those of the author and do
not necessarily reflect the official policy or position of Atomic
Capital, Inc. This is not intended as investment advice. Any content
provided is not intended to malign any religion, ethic group, club,
organization, company, individual or anyone or anything.
Traditional real-world assets, such as gold, are finding higher liquidity by being tokenized.
Utility tokens have traditionally been the modus operandi for
new blockchain company funding rounds, through the initial coin
offering (ICO). But although utility tokens supposedly have value within
the platform they operate on, they often lack a unique value
proposition and likewise, by definition they do not represent an actual
tangible asset. In fact, utility tokens are so far removed from real
world assets, that the U.S. Securities and Exchange Commission (SEC)
have recently been cracking down on those ICOs which cross the
boundaries into the territory of being a security in their efforts to
provide fundamental value to holders.
This
is one of the main reasons that the value of utility tokens, either
during their token sale or once they are trading on third party
exchanges, is driven predominately pure speculation, rather than the
robustness of their tokenomic model.
However, asset-backed tokens, often offered during a Security Token Offering
(STO) carry an actual value, because they are correlated with an
external, real-world asset’s value. Asset-backed and security tokens
offer secure, rapid and minimal cost trading of traditional assets via
blockchain technology, and increase liquidity for traditional
securities.
Why Make an Asset-Backed Token?
Security
tokens, or asset-backed tokens, increase the potential initial raise
for fund operators and other parties who issue securities. However, the
main reason it’s beneficial for crypto fund managers to create
cryptographic analogues of traditional assets is to increase the
underlying assets liquidity — defined as the ease and speed at which
assets are purchased or sold (liquidated) at market price. Generally,
bonds and stocks are assets with high liquidity, in contrast to assets
such as vehicles, real estate, jewellery, art and collectibles which
lack access to high trading volumes, trading opportunities on exchanges,
and liquidity.
But
why is liquidity so important? Liquidity correlates strongly with an
asset’s trading volume, and subsequently affects that assets price. Good
liquidity can enhance the underlying assets value, as it negates the
risk associated with being unable to exit a position in a given asset
quickly. For example, whilst it’s easy to exit a position in a stock via
a third-party exchange, liquidating your position in a piece of
real-estate is a significantly longer process, as in simplest terms, it
takes longer to find a buyer.
A
tokenized asset trading market which trades 24 hours a day, 7 days a
week and 365 days a year not only provides enhanced price discovery and
reduces price volatility, but it may also reduce the risk of a sudden
price crash in asset value.
An Overview of Asset-backed Tokens Use Cases
Tokens
which are backed by external assets are somewhat comparable to gold
backed paper currencies, like many traditional fiat currencies were
under the ‘gold standard’. But the situation becomes more complex when
we examine tokens associated with assets which are ‘non-fungible’— for
example, real estate.
The
real estate market is fairly illiquid, and heavily afflicted with
multiple inefficiencies; such as middlemen who receive a portion of an
investment for taking on counter-party risk. However, these pain points
could be alleviated and given greater value with asset-backed tokens,
which would tokenize a portion of an individuals position in a
real-estate asset.
The
most novel use cases for asset-backed tokens are therefore emerging
from tokenomic models which are backed by limited liquidity assets —
such as derivatives, private equity, real estate, collectibles, and
other assets which have been traditionally difficult to find immediate
buyers for. Currently, assets which are non-fungible are worth
trillions, but are for the most part they are stored in vaults worldwide
as hedges against inflation rates.
Illiquid
assets aside, the largest use cases for asset-backed tokens, which have
the highest potential to raise funds during an STO, generally manifest
from tokenizing a portion of a large established company’s debt or
equity.
A quick look at some examples of asset-backed token use cases include:
The issuance of corporate debt or equity via a security token.
Real
estate investment trusts (REITs), for investors that wish to diversify
their portfolio to include real estate. Real estate investment trust
tokens would also allow customization, and may be purchased by investors
willing to accept a certain credit risks, for a pre-determined
duration.
Equity
from commercial properties and rental income. Retail investors who have
a relatively modest amount of capital are currently unable to diversify
into the commercial property and rental market. Ownership
fractionalization through security tokens offers the opportunity to
democratize commercial and rental investing.
Intellectual
property asset backed tokens, such as film licenses and royalty
payments, may be distributed to every party who owns a portion of a
patent, film, or book.
Accounts
payable and receivable, represented by security tokens, has the
potential to replace supply chain finance and factoring, with tokens and
data flowing between accounts receivable and accounts payable, in ERP
systems.
Real world assets represented as tokens on the blockchain therefore provides access to potentially large addressable markets.
Smart
contracts associated with tokenized assets may likewise improve access
to trading opportunities. Although professional investors can currently
use the services of lawyers and other service provides to perform due
diligence on new investments, investors with lower capital amounts can
generally not afford to take on such risk. Tokens with built in smart
contracts can automate due diligence to an extent, which in turn has the
potential to open markets to retail investors who lack access to due
diligence providers— creating even greater liquidity.
Likewise,
a private equity backed token can be developed to feature protocols
with inbuilt dividend and profit share functions, transforming an asset
class with traditionally low liquidity into a passive income generating
investment. This offers startups and VC firms a greater opportunity for
funding, cost-savings and profit.
Below, we examine the four main asset-backed token categories in greater detail.
What are the Main Asset-Backed Token Categories?
Fine
art could likewise benefit from asset-backed tokens, allowing
fractionalization of paintings — for example among multiple recipients
of inheritance.
Earlier
we introduced an overview of asset-backed tokens, why you would want to
tokenize an asset, and looked at some of the most obvious use cases for
asset-backed tokens.
Now, we are going to break asset-backed token use cases down further into the following four categories:
Debt and equity tokenization
Asset-Backed Tokens for Commodities
Hard Assets which are Non-Fungible
Soft Assets which are Non-Fungible
Debt and Equity Tokenization
Debt
and equity asset-backed tokens are used predominately for funding
start-up companies, which in turn circumvents intermediaries such as
investment banks and traditional exchanges (for IPOs).
Fractional
ownership for equity isn’t a new concept — stock certificates and
mutual funds have already existed for decades. But what asset-backed
tokens now offer is a percentage digital ownership of an immutable,
liquid and trustless representation of company debt or equity.
Anyone
may access the blockchain protocol on which an asset-backed token
resides, including security token exchanges, and may verify the
ownership of the token and the authority of a specified individual to
trade. Arbitrage opportunities for market makers should maintain an
asset-backed token’s trading closely within its true net value.
Debt
and equity are already assets which can be traded today, but blockchain
makes this process more efficient, which could significantly grow the STO
market. Subsequently, a 50% decrease in price (via destruction of asset
value) could easily be counter-balanced by a thousand percent volume
increase (via creation of new market value). This would assist both
incumbents and entrepreneurs alike, who would need to react quickly
during emerging production and marketing industry shifts, which are
expected to enhance value of company assets and company market share.
Holdings
of private equity funds are most often low liquidity assets which
require investors to hold for over one year. Likewise, hedge funds often
hold assets with relatively low liquidity which often require investors
to hold assets for at least a few months. Therefore, enhanced liquidity
via asset tokenization would increase the value of assets for both
private equity funds and hedge funds, enabling private equity ventures
to adapt easily to market fluctuations.
Tokenization of Commodities
Exchange
traded commodities can likewise be converted into security tokens.
Regardless of whether it’s oil, natural gas, wheat, or sugar,
commodities which are already traded on third party exchanges can be
effectively tokenized.
Trading
of other more fringe commodities, like renewable hydro-electric, wind,
and solar electric energy can also be facilitated through a blockchain
based exchange. As a result, governments, utilities companies, and
individuals could participate and transact together on one platform.
However,
tokens which are backed by physical assets require verification to
establish the tokens validity. A mature market already exists for
auditors who verify the security and trustworthiness of custodial
storage facilities for commodities. Those same auditors could take
advantage of new opportunities using blockchain technology, by utilizing
manual assessment methods in conjunction with blockchain tracking —
relying upon technology to create confidence in the market.
Although
gold commonly trades as paper assets through gold ETFs, gold which has
been tokenized is fundamentally different. Each gold backed token
represents a whole or fraction of a a gold bar which is stored and
audited, through the services of an“oracle” provider, for it’s weight,
purity level, and it’s authenticity — Therefore, those who tokenize gold
or other commodities have to first solve the issues with oracle
providers to realize widespread asset-backed token adoption.
The
leading cryptocurrency, Bitcoin, often referred to as ‘digital gold’,
may potentially be replaced as the primary store of digital value by
using tokenized gold. Current advantages which Bitcoin holds over
physical gold, is it’s relatively easy divisibility and transferability.
For example, it is simple for token exchanges to take 1% of a Bitcoin,
sending the equivalent dollar value of BTC into an individuals
cryptocurrency portfolio.
In
contrast, it is conceivably of far greater difficulty to take a gold
bullion bar, fractionalize it, and send it to an individual. If that
gold bar were to be tokenized, one could easily sell and transfer any
given percentage of gold in a similar way to traditional paper
currencies backed by gold— and the same is true for other real-world
commodities.
Hard Asset Tokenization
Hard assets
are tangible and physical items or objects of worth that are owned by
an individual or company. There are many possibilities for the
tokenization of hard assets on the blockchain.
Tokenization of Real Estate
As
we briefly touched on earlier, when compared to REITs or private
property ownership, real estate token funds could become a borderless,
more profitable, and a more democratic way to invest in things such as a
portfolio of rental properties, senior-care homes, or a hotel chain.
With
the rise of real estate backed tokens and tokenized rental income,
investors of every wealth bracket can build out a diverse and flexible
real estate portfolio with minimal exchange fees.
Collectibles tokenization
Bitcoin’s
are fungible. Every Bitcoin is interchangeable, just as Euros, Dollars,
and Pound Sterling. They are indistinguishable from each other, as they
are all, at their core, units of currency and exchange.
In
contrast, asset-backed tokens have the ability to represent exotic and
non-fungible assets, like collectibles, and therefore they are
distinguishable from one other tokens by design. Each token is unique,
creating digital scarcity, with blockchain network participants knowing
how many are in circulation and their distinguishing features.
The
back-end component of non-fungible asset tokenization for exotic assets
have a sophisticated design. Asset management firms which currently
deal with traditional assets may fill new roles as oracles, ensuring the
back-end of non-fungible tokens are kept in safe storage, undergoing
regular audit certification, asset insurance, and conversion mechanisms
from tokens into a physical asset delivery. Auction houses currently
fill this role with fine jewelry, furniture, art, wine, and other
collectibles.
For
example, as it stands, most retail investors lack the opportunity to
buy an ownership share of a rare piece of artwork. Incumbent auction
houses such as Sotheby’s and Christie’s control a majority of secondary
art markets from the world’s financial centres, far from reach for
retail investors. However, smart contracts are being used to create
joint ownership of artworks or art collections stored in museums. These
artworks can still be displayed publicly, but the asset will be encoded
on a blockchain.
Likewise,
it’s possible for individual objects to be tokenized, acting as
appreciating assets. For example, a rare, valuable painting may be
inherited by several siblings. With asset-backed tokens, the painting
could be tokenized and then distributed to each sibling via the
blockchain, becoming “shares” representing a portion of the original
painting. These shares, represented by asset-backed tokens, could be
sold via a public security token exchange, if a sibling wishes to sell
their holdings. In this simplified example, the token holders have
access to immediate liquidity, while private investors can add a
valuable exotic asset to their portfolio, which they would normally not
have exposure to — therefore, a novel class of exotic assets are given
previously unrealized liquidity.
Non-Fungible Soft Asset Tokenization
Soft assets, in contrast to hard assets, are intangible assets,
which have been traditionally hard to quantify and evaluate.
Asset-backed tokens can likewise bring price discovery and liquidity to
these assets.
Intellectual Property (IP) Tokenization
Somewhat
harder to quantify than other assets we have examined, IP assets, such
as copyright licences, trademarks, patents and royalties from music and
media rights generally have low liquidity and currently lack a secondary
marketplace to trade on. It is not a difficult concept to tokenize the
IP ownership, but the realized benefits could be many — such as enhanced
liquidity and increased value of IP assets, bringing benefits to media
producers and artists.
Digital Asset Collectibles Tokenization
Digital
collectibles, such as CryptoKitties, are examples of asset-backed
tokens which generate value and scarcity. This is in contrast to
ownership of digital collectibles, which is managed via central
databases, such as vanity items earned during whilst playing online
games. These assets have been traditionally difficult to prove ownership
over, as they are often just represented as contracts with the software
provider. However, blockchain could offer digital collectibles
specialized marketplaces, created with asset-backed tokens.
Stable Coins are not Typical Security Tokens
By
certain definitions, stable coins linked to fiat are a form of stable
asset-backed token. Stable coin issuers in this case maintain fiat
reserves, so they retain a stable ratio with their chosen fiat currency,
which is then matched to the circulating supply of the specific stable
coin.
Stable
coins are distinctly different from security tokens as they’re not a
means of investment. Instead, they are created to represent currencies
rather than assets. Stable coins provide an easy exit for investors who
trade cryptographic assets on token exchanges, and remain fundamentally
distinct from security tokens representing assets.
Opportunities and Challenges for Security Tokens
Compared
to traditional currency, Bitcoin has been generally regarded as having
greater fungibility, divisibility, transferability, scarcity, and
durability. Likewise, asset-backed tokens retain most of the same
benefits, applying them to real assets.
Regulators
are eyeing security tokens with caution. There could be high risks for
new user error whilst using exchanges, and investors who are not
cautious may lose their tokens through wallet address mishaps for
example, something protected against when using traditional third-party
exchanges.
As
a result of regulatory uncertainty, some countries, such as China and
Qatar, have completely banned asset-backed tokens being issued. Other
countries, such as Bermuda, Switzerland, Estonia, and Liechtenstein,
allow security token issuance, albeit with certain restrictions and
confusing regulatory oversight.
Malta,
by contrast, places no limitations or restrictions on asset-backed
tokens. Approval, fund certification, and fund license requirements are
legally well-defined, with regulatory stringency. These conditions make
Malta the premier jurisdiction to issue asset-backed or security tokens.
Asset-backed
and security tokens are, by design, prone to lower volatility than
utility tokens and cryptocurrencies. As discussed, tokens listed on
exchanges may trade constantly, offering greatly enhanced price
discovery. Markets which operate irrespective of geographical location
or time zones may provide security token trading opportunities to
investors worldwide. Likewise, established companies may soon begin
issuing security tokens worth billion of dollars into token exchanges —
creating one of the most exciting asset classes seen in decades.
Friday, June 29, 2018
China's penetration of Silicon Valley creates risks for startups
SAN
FRANCISCO (Reuters) - Danhua Capital has invested in some of Silicon
Valley’s most promising startups in areas like drones, artificial
intelligence and cyber security. The venture capital firm is based just
outside Stanford University, the epicenter of U.S. technology
entrepreneurship.
FILE
PHOTO: Stanford University's campus is seen in an aerial photo in
Stanford, California, U.S. on April 6, 2016. REUTERS/Noah
Berger/File Photo
Yet it was also established and funded with help from the Chinese government. And it is not alone.
More
than 20 Silicon Valley venture capital firms have close ties to a
Chinese government fund or state-owned entity, according to interviews
with venture capital sources and publicly available information.
While
the U.S. government is taking an increasingly hard line against Chinese
acquisitions of U.S. public companies, investments in startups, even by
state-backed entities, have been largely untouched.
That may
well be poised to change as the U.S. Congress finalizes legislation that
dramatically expands the government’s power to block foreign investment
in U.S. companies, including venture investments.
The new law
would give the U.S. government’s Committee on Foreign Investment in the
United States (CFIUS) wide latitude to decide what sorts of deals to
examine, eliminating certain ownership thresholds, with a particular
focus on so-called “critical” technologies.
“The perception is
that a lot of the tech transfer of worry to the U.S. security
establishment is happening in the startup world,” said Stephen Heifetz, a
former member of CFIUS and now a lawyer representing companies going
through CFIUS review.
Sponsored
The
latest version of the bill exempts “passive” investors, which would
cover many of the limited partners that back venture firms. But limited
partners that have some control over the business, or firms whose
managing partner is a “foreign person”, could be subject to scrutiny.
The
university endowments and family offices that traditionally provide
most of the money for venture firms are usually one of many limited
partners and have minimal if any involvement in the startups they help
fund.
Chinese entities also sometimes take a passive role in big
venture funds. But venture capital sources say that Chinese government
funds often play a more influential role in the smaller venture firms
they back by providing a greater percentage of their funding. That
empowers them to request information about startups or help them to
open offices in China - potentially opening those startups to CFIUS
review.
The possibility of a regulatory crackdown has caused
unease in the startup world. Venture firm Andreessen Horowitz is
counseling startups that if they raise money from a China-backed
investor, they put themselves at risk of government scrutiny, a person
with knowledge of the matter said.
“The window for some
startups to raise money from China may be closing,” said Chris
Nicholson, co-founder of AI company Skymind, which has raised money from
Chinese Internet group Tencent Holdings Ltd and a Hong Kong family
office.
SENSITIVE AREAS
Until recently, the original
source of funds for venture investments has not been an issue in Silicon
Valley. Venture firms are not obliged to disclose who their investors
are and entrepreneurs rarely ask, leading some dealmakers to question
how CFIUS could keep tabs on startup investing.
Danhua Capital,
which is backed by the Zhongguancun Development Group, a state-owned
enterprise funded by the Beijing municipal government, has holdings in
some of the most sensitive technology sectors.
Its
investments include data management and security company Cohesity,
which counts the U.S. Department of Energy and U.S. Air Force among its
customers. Drone startup Flirtey, which in May was selected by the U.S.
Department of Transportation to participate in projects to help the
agency integrate drones safely into U.S. air space, is also part of the
Danhua portfolio.
Shoucheng Zhang, Danhua’s founder and a
Stanford University physics professor, declined to answer specific
questions from Reuters. In an email, he said: “Most of our (limited
partners) are publicly listed companies in New York or Hong Kong stock
exchanges. We will of course fully comply with any legislations and
regulations.”
Cohesity declined to comment. A spokeswoman for
Flirtey said Danhua’s minority investment did not come with any
information rights or a board seat, and the firm is not involved in
Flirtey’s operations.
“We would not knowingly accept money from
the Chinese government; we take investment from Delaware-registered,
Silicon Valley-based venture capital firms,” the spokeswoman said.
She
added that Flirtey would support any new “mandate that investors must
disclose if they have any form of backing from government entities, to
help ensure there is never a question in the future.”
The
practice of investing through layers of funds, known as funds of funds,
can make it all but impossible to know where money is coming from.
Westlake Ventures, backed by the Hangzhou city government in eastern
China, invests in at least 10 other Silicon Valley venture funds,
including Palo-Alto based Amino Capital.
Larry Li, founder and
managing partner at Amino Capital, said he took the money that was on
offer when he launched his fund in 2012. He said he felt his firm wasn’t
the kind of known quantity that could tap the big pensions and
endowments.
“We weren’t going to the Harvard endowment or Yale
endowment; that’s like mission impossible,” Li said. “You need to have
some special source of funds to get started.”
China-backed
funds include Oriza Ventures, which belongs to the investment arm of
the Suzhou municipal government, and has backed AI and self-driving car
startups. SAIC Capital, the venture arm of state-owned auto company SAIC
Motor, has invested in Silicon Valley autonomous driving, mapping and
artificial intelligence startups.
Even well-known startup accelerator 500 Startups raised part of its main fund from the Hangzhou government.
500 Startups and Oriza declined to comment, while SAIC did not respond to a request for comment.
Capital
controls have slowed the flow of Chinese money into the United States
since 2016, but sources say venture investments have been more resilient
than sectors like real estate, in part due to the Chinese government’s
focus on improving its domestic high-tech industry.
‘CROWN JEWELS’
U.S.
politicians suspicious of China’s intentions were galvanized by a
Department of Defense report released last year that warns that Chinese
venture investors are accessing “the crown jewels of U.S. innovation.”
The
report helped guide Sen. John Cornyn, a Texas Republican who sponsored
the Senate version of the CFIUS reform bill, people with knowledge of
the matter said. A spokeswoman said Cornyn “is especially concerned with
Chinese state-backed venture capital investments.”
But the report was also panned by many private sector experts as overly simplistic and fear-mongering.
For
now, at least, President Donald Trump has backed away from his declared
intention to clamp down on a wide range of Chinese technology
investments through a special emergency order, saying he would leave the
job to CFIUS. But if Congress fails to pass the bill quickly, Trump
said he would use his executive powers.
Reporting
by Heather Somerville in San Francisco. Additional reporting by the
Shanghai newsroom.; Editing by Jonathan Weber and Martin Howell.