skip to main |
skip to sidebar
September Personal Income and Spending 2010


Highlights
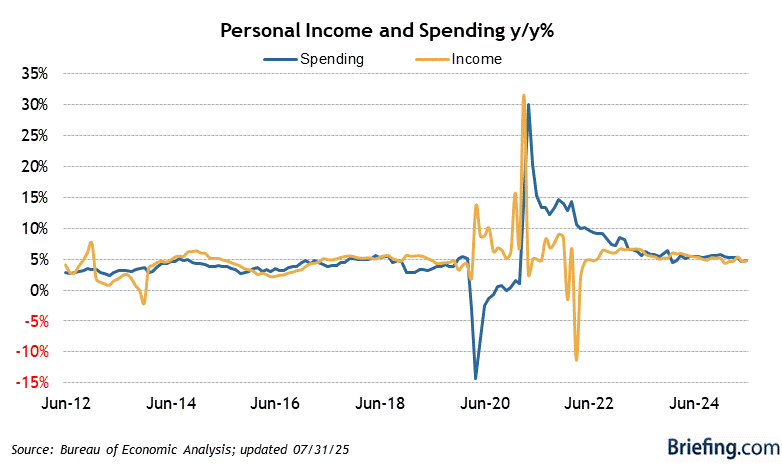
- Personal income rose 0.5% in August, up from 0.2% in July. The Briefing.com consensus expected income to rise by 0.3%.
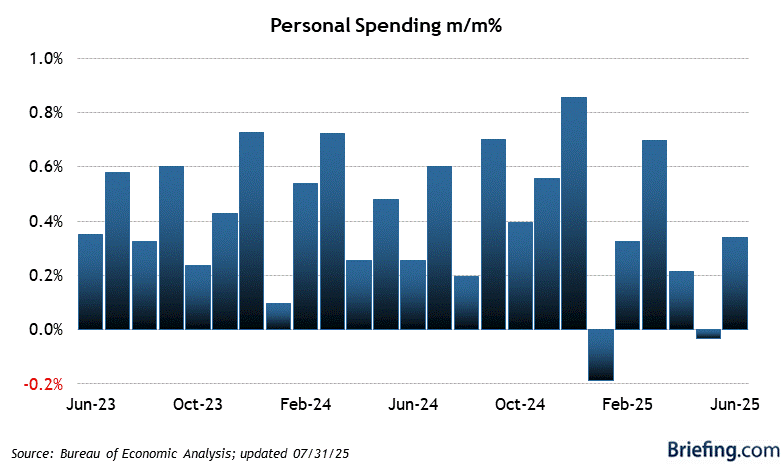
- In conjunction with the increase in income, personal spending rose 0.4% in August and outperformed the consensus expectation of 0.3% growth.
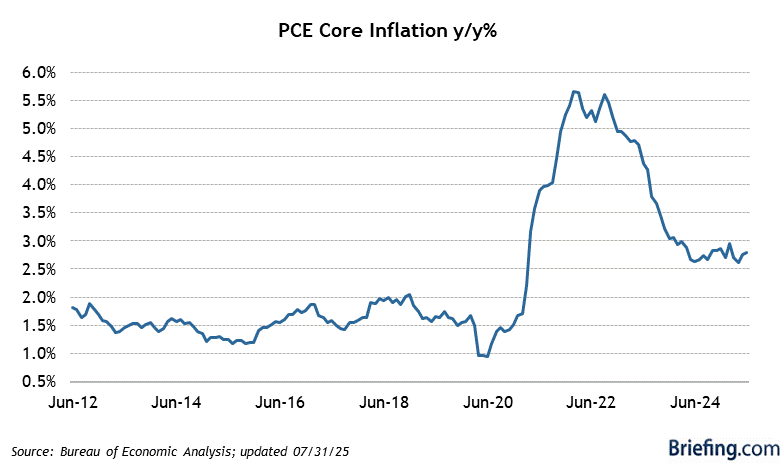
- Inflation remains subdued as core PCE prices increased 0.1%, exactly what the consensus expected. The year-over-year growth rate remained at 1.4% and is below the 1.5% - 2.0% Fed inflation target. Accordingly, the market will continue to find reason to think further quantitative easing is on the way.
Key Factors
- The increase in income was not due to gains in the private sector. Instead, the government caused the spike when it failed to extend the emergency unemployment insurance at the beginning of July. This caused net income to decline by $17.1 bln. When the extension was finally passed toward the end of the month, a flood of unemployment benefits passed through to consumers, increasing income by $20.6 bln or 0.2% in August.
- Since the employment report revealed that weekly earnings increased by 0.3% during the month, it seems the difference between the consensus forecast and the actual is due to the surge in unemployment benefits.
- Unfortunately, the passage of the extension was just a minor stop-gap measure and workers continue to lose their unemployment benefits at a rapid rate. Without the passage of another extension, the benefits will tick down over the coming months and negatively impact income.
- The gains in personal spending matched the increase in the retail spending report released earlier in the month.
Big Picture
- While off their lows, sustainability in the personal income and consumption sector look weak. High unemployment will put heavy downward pressures on wage growth. Since consumption has a direct relationship with the amount of income a consumer has to spend, lower incomes will cause consumption growth to be weak. We believe there is pent up demand for more consumable goods, but until the employment situation stabilizes consumers will hold on spending.
| Category | AUG | JUL | JUN | MAY | APR |
| Personal Income |
|
|
|
|
|
| Total Income | 0.5% | 0.2% | 0.0% | 0.4% | 0.5% |
| Wage and Salary | 0.3% | 0.4% | -0.2% | 0.5% | 0.4% |
| Disposable Income | 0.5% | 0.1% | 0.0% | 0.4% | 0.5% |
| Savings Rate | 5.8% | 5.7% | 6.0% | 6.0% | 5.9% |
| Personal Consumption |
|
|
|
|
|
| Total (Nominal) | 0.4% | 0.4% | 0.0% | 0.2% | -0.1% |
| Total (Real, Chain $) | 0.2% | 0.2% | 0.1% | 0.3% | -0.1% |
| Core PCE Deflator |
|
|
|
|
|
| Month/Month | 0.1% | 0.1% | 0.0% | 0.1% | 0.1% |
| Year/Year | 1.4% | 1.4% | 1.4% | 1.5% | 1.5% |


No comments:
Post a Comment