Disclosure: I am long SPY, .
On Friday January 3, 2013, the S&P 500 index closed
just below its all-time intraday high of 1849.44. Currently at 1831.37,
the S&P 500 is only 0.98% below its all-time record high while
ECRI's Weekly Leading Index, WLI, is at a 191-week (3.7-year) high. SPY, the exchange traded fund for the S&P 500, is also only 0.98% off its recent all-time high.(click to enlarge)
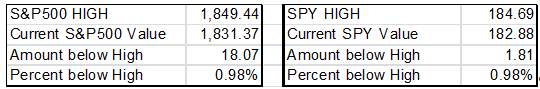
Chart 1 Showing S&P 500 from 1997 through January 3, 2014
(click to enlarge)
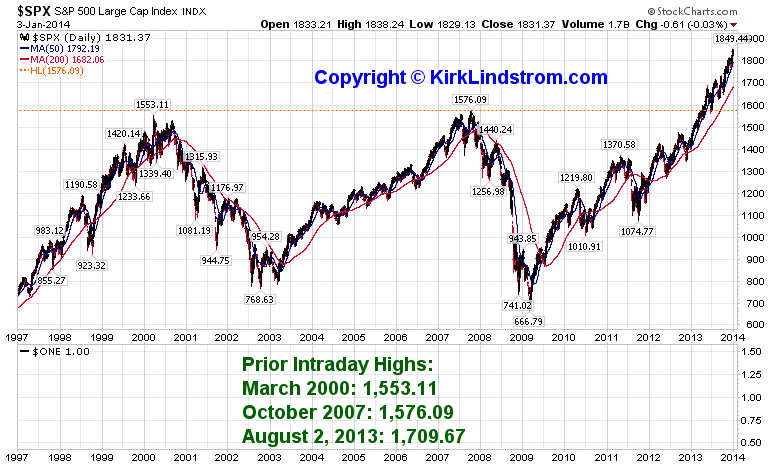
S&P500 Chart Scan
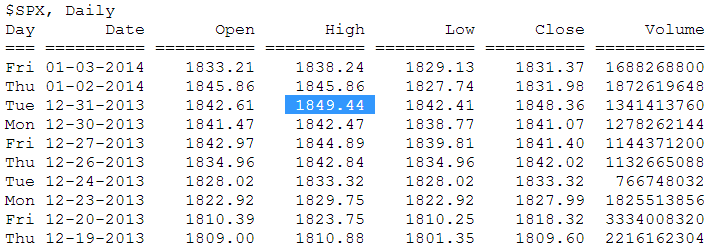
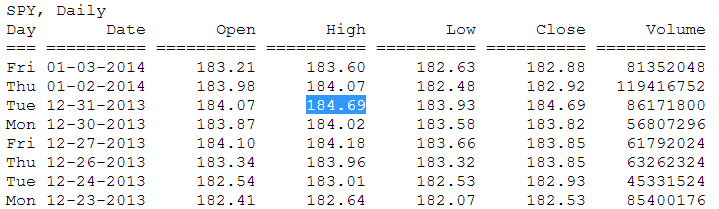
Table 1 showing Recent S&P500 Data
(click to enlarge)
In my February 2011 article "How to Play Expected Inflation from the TIPS Spread," I wrote I was long SPY, as one way to benefit from expected inflation. "I also believe it is a good time to own equities including SPY, the exchange traded fund for the S&P 500, for both inflation protection and income."
I have been correct to recommend SPY here on Seeking Alpha for the past few years despite ECRI's fears of a recession. Currently, SPY adjusted for dividends remains well above past highs. The raw price index for SPY, without dividends and shown in green on my graph below, also remains above prior highs made in 2000 and 2007.
Chart 2 Showing SPY Adjusted for Reinvested Dividends.
(click to enlarge)
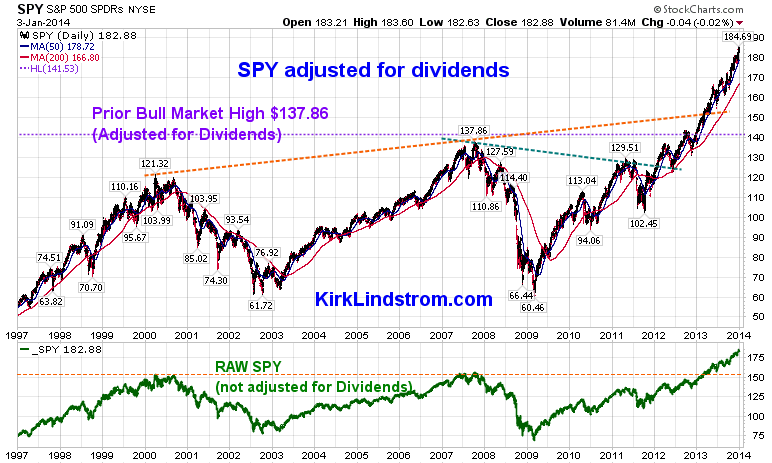
SPY Chart Scan
Table 2 showing Recent SPY Data
(click to enlarge)
Despite the markets making new record highs and the current press release from the Bureau of Economic Analysis estimating Q1-2013 GDP grew at a modest 4.1% annual rate, ECRI said the "recent U.S. GDP release featured significant revisions, with extensive conceptual changes enacted back to 1929." ECRI believes that similar 1.4% revisions, perhaps years from now, will show the US was in a recession in Q4-2012 through Q1-2013.
From an August 30 Snapshot of ECRI's Website
(click to enlarge)

On Friday January 3, 2013, the Economic Cycle Research Institute (ECRI), a New York-based independent forecasting group, released its latest readings for its proprietary Weekly Leading Index (WLI) for the period ending during the prior week. In the latest release, for the week ending December 27, 2013:
- WLI was 132.9, up compared with the prior week at 131.9
- Important WLI highs for the last 3+ years back to 2010 are:
- September 20, 2013 = 132.7 (177 week high)
- April 15, 2011 = 131.7
- May 7, 2010 = 131.9
- April 30, 2010 = 134.9
- The lowest reading for WLI on record was 105.3 for the week ending March 6, 2009.
- WLI growth was flat at positive 1.8% compared with the prior week at positive 1.8%.
- The lowest reading for WLI growth on record was negative 29.9% on Dec. 5, 2008. It turned higher months before the stock market bottomed on March 6, 2009, at 666.79.
- Occasionally the WLI level and growth rate can move in different directions because the latter is derived from a four-week moving average.
(click to enlarge)
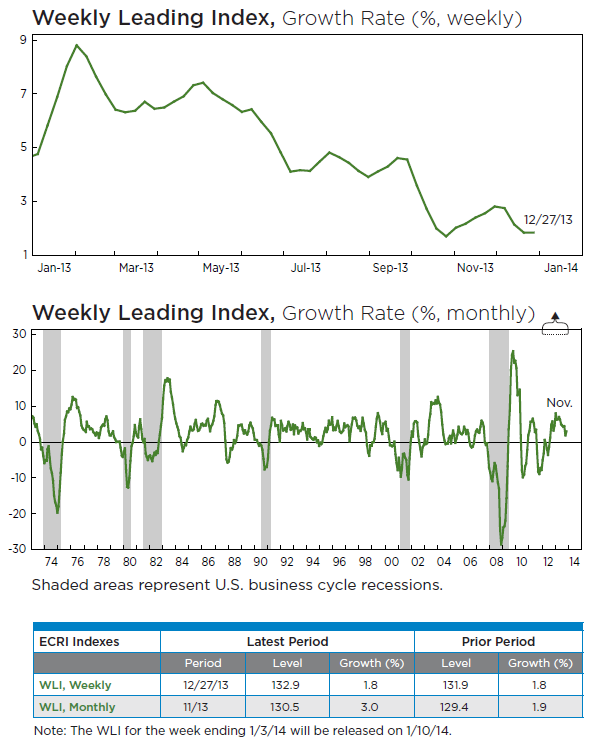
Annual WLI growth: Based on a simple, year-over-year annualized basis, annual WLI growth rose to 5.2% up from the prior week's reading of 3.5%.
Chart 4
(click to enlarge)
If ECRI is correct that we had a recession that will show in future revisions to GDP, would it be one of the 20% of recessions that come without a bear market in stocks? ECRI's managing director, Lakshman Achuthan, said "In three of last 15 recessions there was no bear market, 1980, 1945 and 1926-27. (The) '80 recession was really short, '45 was end of WWII and '26-'27 was Roaring Twenties."
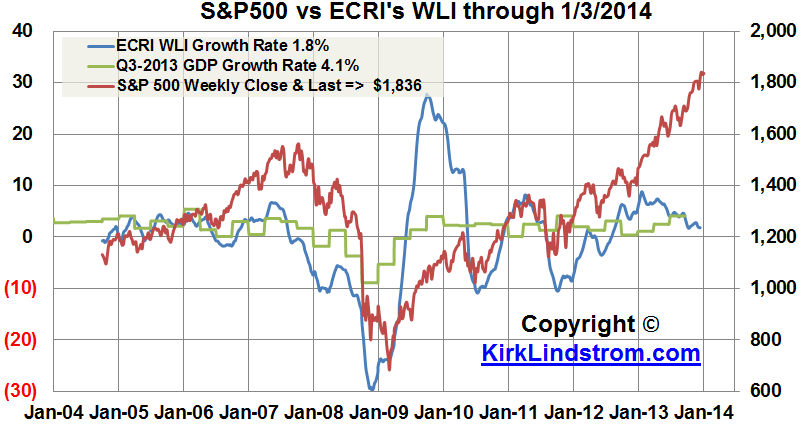
Does SPY Lead WLI or Does WLI Lead SPY?
Since ECRI releases WLI numbers for the prior week, and the stock market is known in real time, you can sometimes get a clue for next week's WLI from the weekly change in the S&P 500 or its exchange-traded fund, SPY. But this is not always the case. Specifically, in the lead up to the last two recessions, the WLI turned down months before the stock market did.
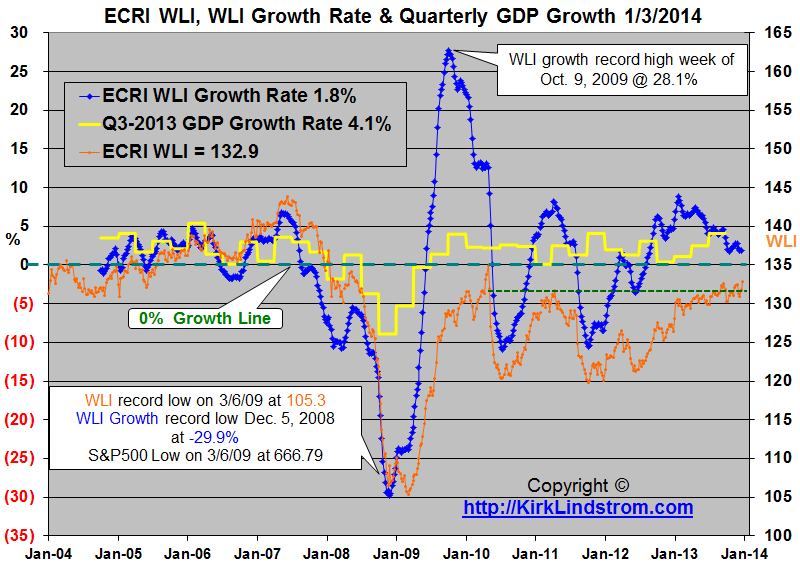
Chart 5: S&P 500 vs. ECRI's WLI Growth Rate (click to enlarge)
(Note, I would plot SPY vs. WLI, but I don't have the weekly data in my spreadsheet going back as far since I only started trading SPY in early 2007.)
Over the next 10 years, I expect the S&P 500 will keep up with inflation and the dividend it pays should grow with or even exceed inflation. An added benefit to owning equities is that the dividends and capital gains currently get favorable tax treatment. Finally, Treasury rates are artificially low (see Current U.S. Treasury Rates at a Glance) giving all bond funds significant interest rate risk.
I was asked in my Facebook group, "Investing for the Long Term" why I own SPY: "I'm confused - if the ECRI is projecting a recession, why are you long SPY? Is it a market timing strategy?" My answer was:
"I don't believe in 'all or nothing' market timing. I explain it more in my newsletter, but I'll adjust my allocation to stocks based on many things including ECRI's outlook. My last two moves for SPY was to sell SOME shares earlier this year when higher and buy them back on June 4, 2012 at $127.50 using 'Auto Buy and Sell targets' in my monthly newsletter. Hope that helps. (Seeking Alpha requires its writers to disclose if we hold a position. Thus, I would report I was long SPY even if SPY was only 1% of the portfolio with the other 99% in cash.)"We had a good discussion of the first estimate of Q1-2013 GDP release in my "Investing for the Long Term" Facebook Group. Several questioned how ECRI could think we are in a recession with 2.5% GDP growth.

I posted Lakshman's answers to our group at Q1 GDP and ECRI Clarification on Recession Call. ECRI believes future revisions to GDP will prove them correct. Here is a key excerpt:
- You're not alone in thinking our recession call was wrong. Still, the facts are that the GDP release on August 28, 2008 - with the economy eight months inside the Great Recession - revised Q2/08 GDP growth to 3.3% from 1.9%, up from 0.9% in Q1/08. But both of those data points, as well as GDP data for the first two quarters of the 2001 and 1990-91 recessions, were subsequently revised by 2 to 4 percentage points over time. This is how real-time data often behave during recessions.
The S&P 500 fell 0.5% last week which will give the market a small, negative influence on WLI for the next weekly reading. It is very possible that SPY and several of the stocks in my newsletter "Explore Portfolio" that lead out of recessions and bottomed months ago are pointing to an economic recovery even before most economists agree with ECRI that we had a recession. So far, the 2% payroll tax increase on everyone and the slowdown in government spending due to the "sequester" were not enough to cause Q1 and Q2 of 2013 to record the first quarter of negative GDP growth in many years.
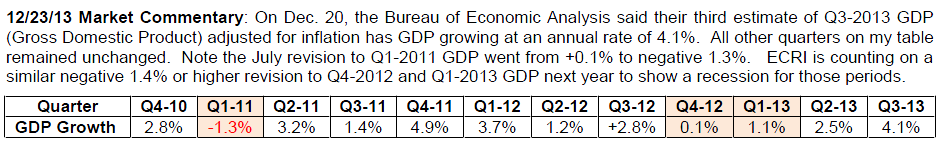
Will future revisions to GDP show Q4 2012 and Q1-2013 were negative values typical of a recession?
Chart 7: Excerpt from my 12/23/13 newsletter showing GDP by quarter:
(click to enlarge)
The current data suggests ECRI was wrong when they said a new recession was unavoidable. Future negative revisions may show they were correct. ECRI was correct that the economy was not healthy. ECRI was also correct that the job market would suffer, but it seems to be slowly improving. Clearly taxing savers with massive QE by the Federal Reserve to help the government spend more than it takes in appears to have worked to avoid an "official recession."
What do you think?
Notes
- I trade SPY around a core position in my newsletter's "Explore Portfolio" and with my personal account. With dividends reinvested, my explore portfolio holds 132.575 shares of SPY with a "break-even" price of $102.80. I also have the index fund version of SPY in both my newsletter's "core" portfolios.
- ECRI uses the WLI level and WLI growth rate to help predict turns in the business cycle and growth rate cycle, respectively. Those target cycles are not the same as GDP level or growth, but rather a set of coincident indicators (including production, employment income and sales) that make up the coincident index. Based on two additional decades of data not available to the general public, there are a couple of occasions (in 1951 and 1966) when WLI growth fell well below negative 10, but no recessions resulted (although there were clear growth slowdowns).
- For a better understanding of ECRI's indicators, read its book, "Beating the Business Cycle
 ."
." - SPY is the exchange traded fund for the S&P 500 Index.
- VTI is Vanguard's "Total Stock Market" exchange traded fund. If you want to invest in a single fund, that is my first choice over SPY. I recommend SPY and several others in my core portfolios for more opportunities to rebalance.
- VOO is Vanguard's new exchange traded fund that tracks the S&P 500 Index. It is a lower cost alternative to SPY. I own and write about SPY, as I have many years of data for it, but VOO could do slightly better than SPY over time because it has a lower expense ratio.
- S&P500 Chart Scan and SPY Chart Scan
No comments:
Post a Comment