Market Timing Report: Buckle Up For 2014
Editor's note: This report was initially released to the author's subscribers on 12/15/13. All references to specific dates should be read accordingly.
Any skillful manager must end each year by analyzing performance for the previous year and also looking forward to what may occur in the year to come. Is there anything that should have been approached differently? Should a new tactic be used in the coming year? We ask the same universal questions here at LMTR.
Even though the bears were overbought a month or two ago, and fall liquidity has carried us higher than anticipated, our negative position is not nullified. In fact, the current market environment has taken a nosedive. Sentiment is more extreme, and the bears have hit a 30-year low (a number not seen since 1987). There is aggressive insider selling, and the breadth of the market is definitely beginning to wane. When volatility picks up to the downside, the investment community will receive a large “gut check”, and the indicators will adjust thereafter. As margin debt remains at an all-time high, one must wonder what will take place when the market inevitably declines and margin calls occur for these weak-handed owners. Without a doubt, 2014 is going to be a bumpy ride!
Anecdotal Observations
click all images and charts to enlarge

LMTR has highlighted the contrarian concept of bullish magazine covers in past issues. In the last 6 months we’ve focused your attention on 3 specific covers, but recently more such periodicals have published overtly bullish cover stories. Please note the recent issues of the Economist,Time magazine and Germany’s Wirtschafts Whoche. Periodical covers are a lagging indicator, meaning that by the time media is placing such events on their front covers the story has already occurred.
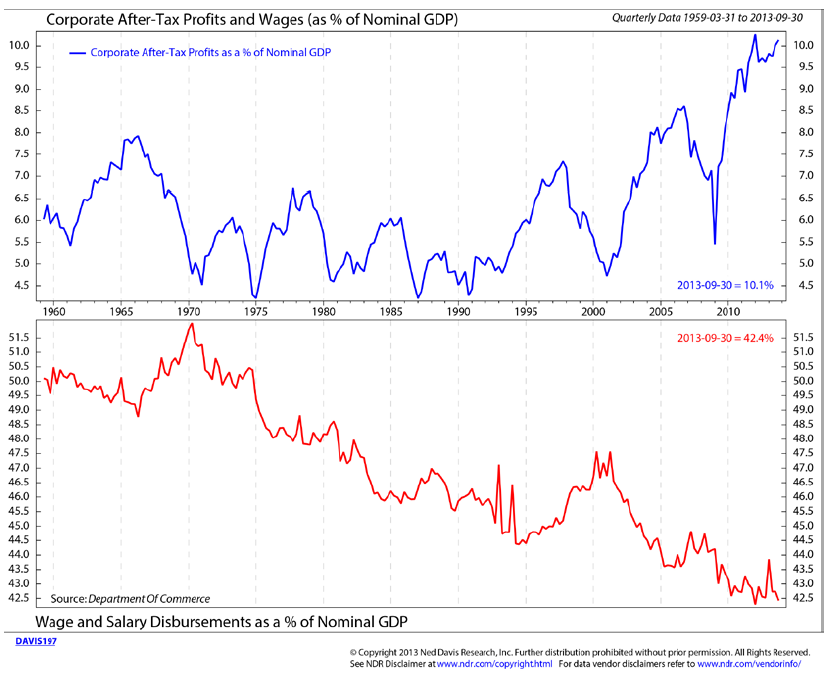
Last month’s LMTR indicated that operating margins were at a 60-year high. The widespread disparity between wages as a % of GDP has trended downwards, and this current situation is about the best corporate profits can expect in relation to gouging their workers. Such profit spreads are the most advantageous that corporations have seen in the past 50 years. In our opinion, such a large profit spread is unsustainable.
IPO’s tend to flourish in more mature stages of a recovery, so it is relevant to investors that Renaissance Capital recently launched an ETF (IPO) that tracks/invests in IPO’s. We are currently experiencing the highest secondary market in the past 19 years…..but keep in mind, records do not go back further than 19 years. Thus far, 2013 has hit $55 billion in IPO’s, which was only outdone by the $62 billion that occurred in 2000. This mature trend cannot be sustained.
Indicators
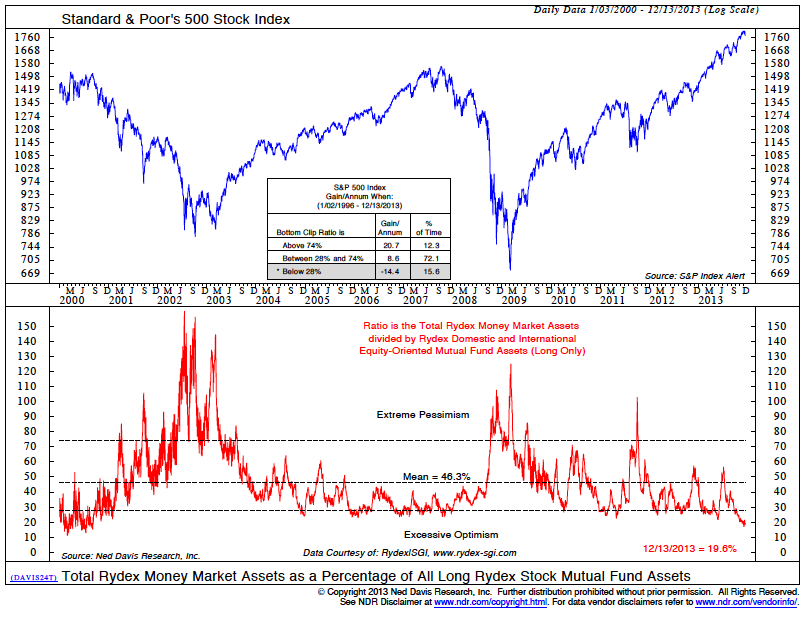
The Rydex family of funds carefully tracks their own asset flows, thereby producing some interesting indicators. This particular chart, produced by Ned Davis, tracks Rydex money market assets as a percentage of their long stock mutual fund assets. One should note that during periods of serious downward market pressure, the indicator jumps up to the 80+ range. Conversely, during overbought markets the indicator falls. A reading of 30 or below is negative, demonstrating that the general market participants are leaning too aggressively on one side. The current reading is at a very negative 19.3.
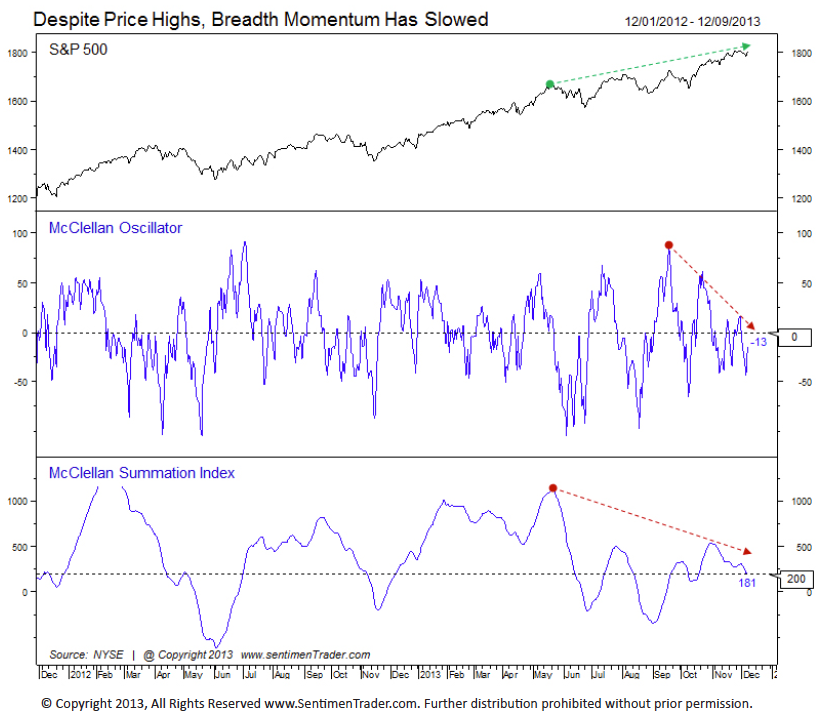
The McClellan Osscillator and Summation Index is currently positioned with a great deal of negative divergences. As the S&P has continued to hit a series of higher highs, the indicators have begun to hit a series of lower highs. This shows that breadth and sponsorship are beginning to fall off, which is negative.
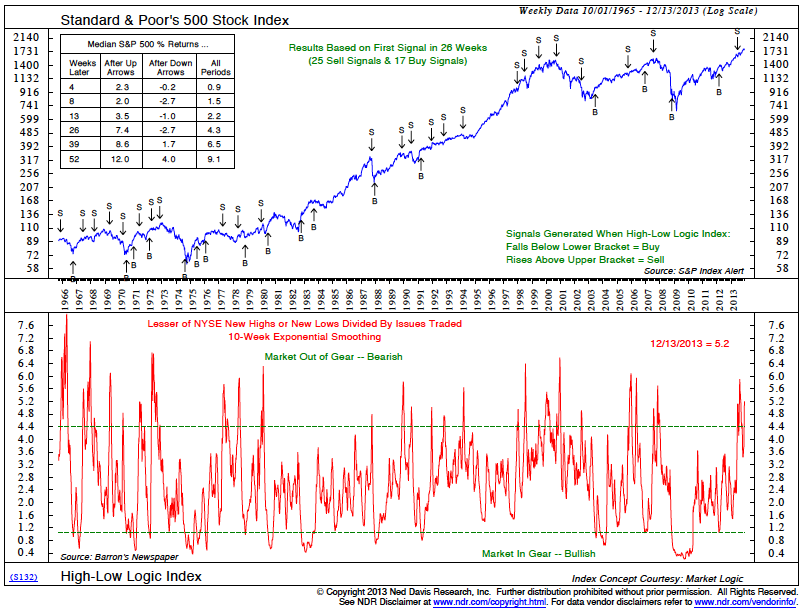
The High-Low Logic Index is one of my personal favorites. It was created by Market Logic and is displayed through Ned Davis Research. This tool is produced by calculating the lesser of the NYSE new highs or new lows divided by the total number of issues traded. A number is derived, and thereafter a ten-week moving average is used to smooth out the data. This indicator allows us to monitor new highs or lows in a quantitatively driven fashion. When we see a buy or sell signal, it can reinforce other indicators that are being used concurrently. The most recent sell signal, generated several weeks ago, remains intact. At 5.3, we are clearly in an “out of gear” position.
Sentiment
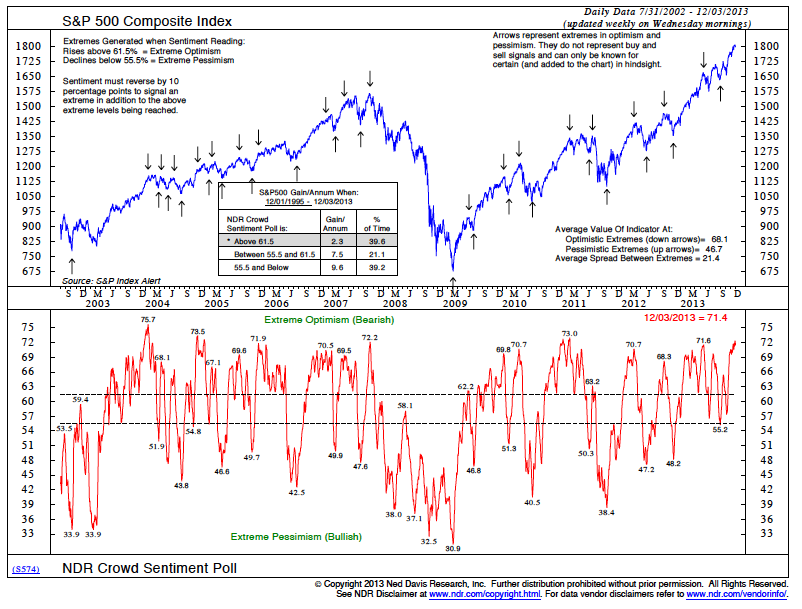
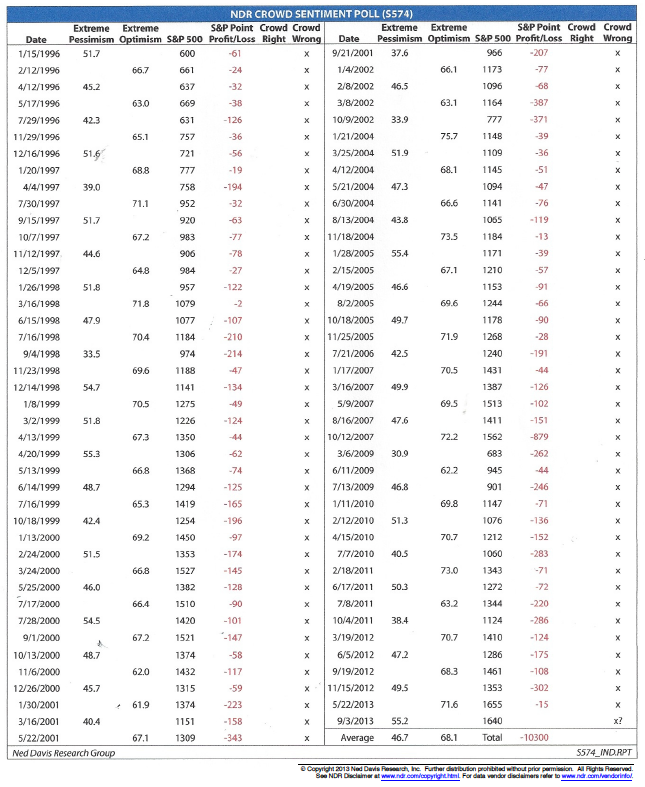
Crowd Sentiment is Ned Davis Research’s primary sentiment gauge. It is currently at 71.4, which is an overly optimistic number. To illustrate the track record for this indicator we have included a bar chart and data table, both going back 19 years. These tools give the reader an idea of what to expect with such high sentiment.
This shows a -16.6% annualized decline after the extreme has been set.
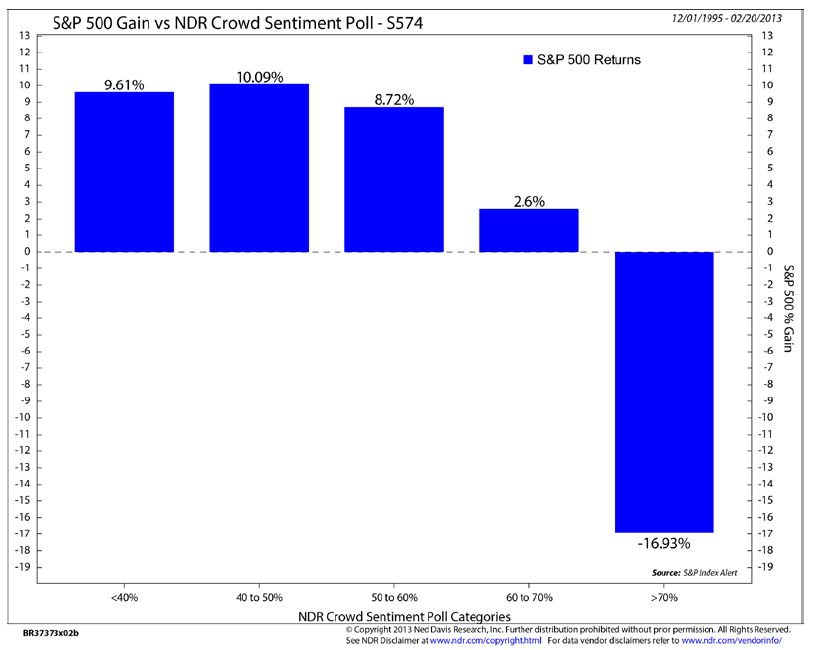
After periods of high sentiment, this indicator has achieved 100% accuracy.
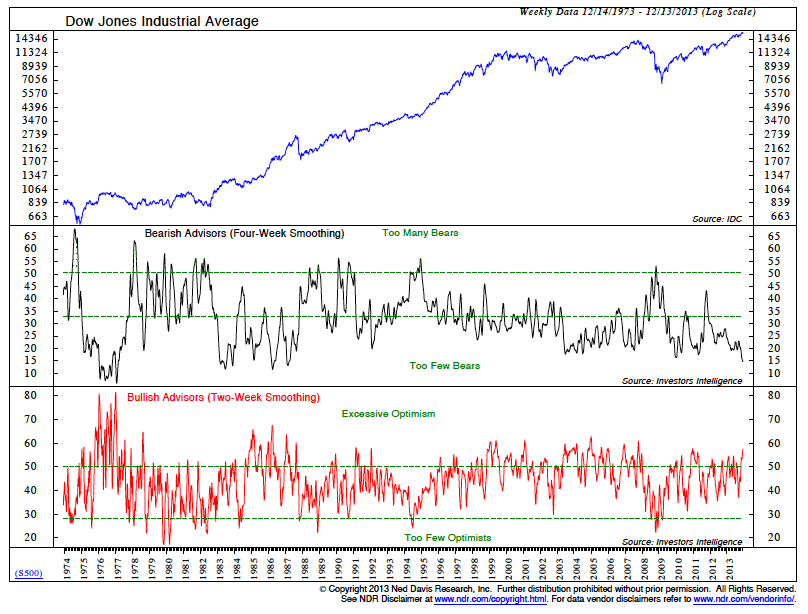
Sentiment data indicates that history is about to repeat itself. Sentiment numbers are released every Wednesday by Investors-Intelligence Chart Craft. Their data, which goes back 50 years, is gathered from 150 newsletter writers. The bears have now reached a 30-year low, even though bullish sentiment has not reached a 30-year high. This 30-year low is a highly complacent number that has not been seen since 1987. At that time sentiment remained low all through the spring and summer (even dipping to the 12-range) right up until the 1987 crash. Since history does repeat itself, investors should be cautious.
The next chart, also provided by Ned Davis, shows the Investor’s Intelligence bulls/bears figures on a 40- year chart. The bulls have reached 58.3, which is indeed high and overly optimistic. However the bears, at 14.3, are at a 30- year low. This shows that the bears are in a tremendously complacent position, one not seen since the spring of 1987.
The Vickers’ Insider Index, created by the Argus group, monitors corporate insider activity. When the gauge is below 15, it indicates that tremendous insider selling is taking place in the marketplace (bearish). When the gauge reaches +2.5 or higher, it indicates that large amounts of insider buying are taking place (bullish). We are currently well below –15, which suggests that an excessive amount of insider selling is occurring. This is a very negative reading.

Liquidity
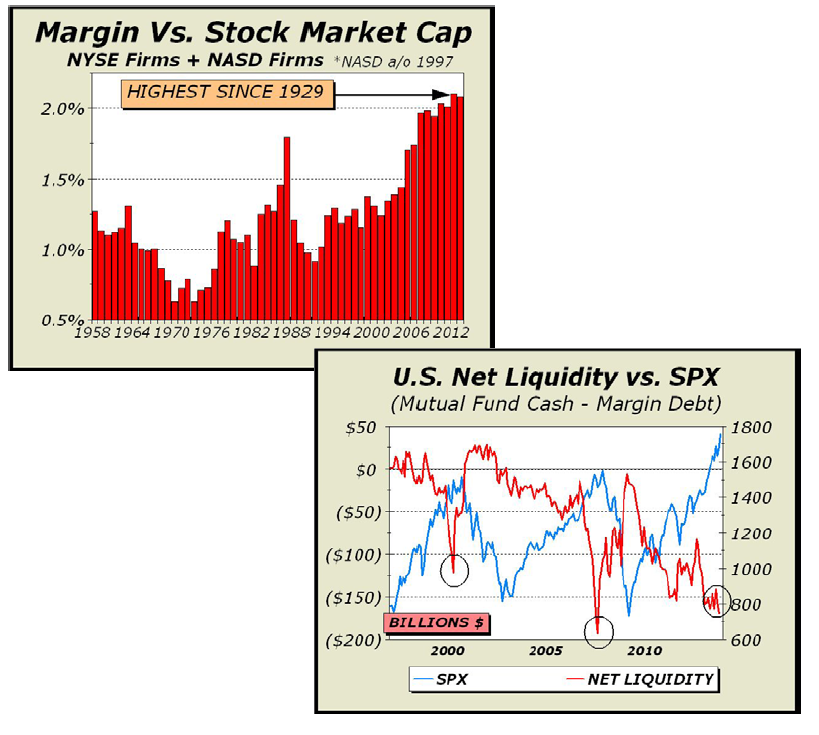
In the past few issues we’ve indicated that margin debt is at an all time high. Interesting new calculations, created by Cross- Currents.com, reinforce our initial assertion that leverage is indeed at excessive levels. The first chart analyzes margin versus stock market capitalization, and the second focuses on mutual fund cash minus margin debt. This type of speculation has historically been highest at market tops and lowest towards market bottoms.
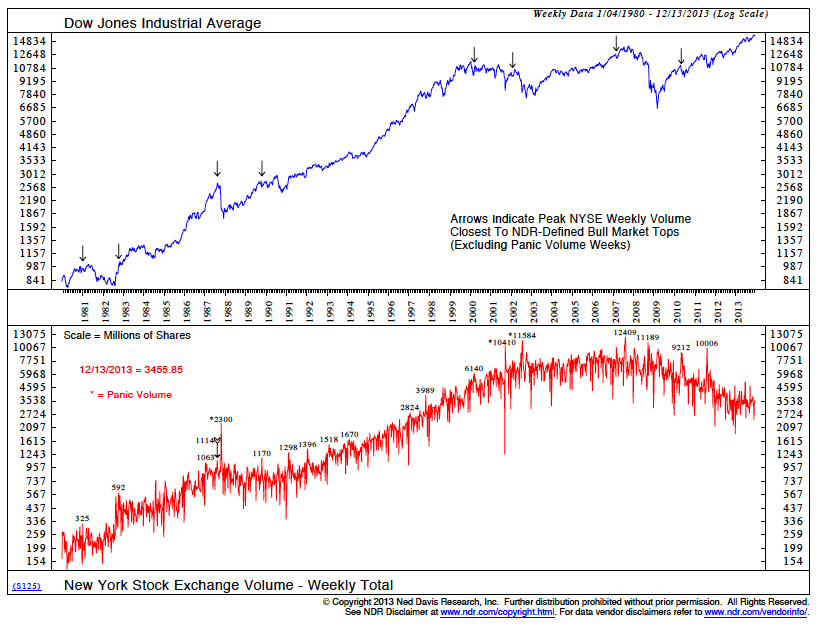
NYSE volume should also be noted. When the stock market is rising, it is important to see volume accelerate upwards because it shows that institutions are continuing to accumulate securities. While a rally can occur on light volume, such a move tends to be suspect. This chart displays an upward trend over the last 25 years. A rally took place until the last 2-3 years, and at this point volume actually began to decline. Such a move tells us that “big money” is not supportive of the current rally.
Credit spreads (the difference between corporate and government debt) are now trading at a 30-year low. This shows that general complacency has dropped to an extreme, where basic corporate debt is trading parallel to government debt. While our government has the power to print money to cover debts, corporations do not have such a luxury. Therefore, the inherent bankruptcy risk is much greater in the corporate arena. Currently, credit spreads are far too complacent.

Conclusion
After reviewing various indicators, we continue to keep our bearish stance and plan on raising our short position to become more fully invested. This will occur at some point in January, and at this time subscribers will receive an LMTR alert. One never knows exactly what type of correction to expect. But with so many extremes, a reversion to the mean is likely to occur within the next few months. Buckle up and get ready for this bumpy ride!
Disclaimer
Lamensdorf Market Timing Report is a publication intended to give analytical research to the investment community. Lamensdorf Market Timing Report is not rendering investment advice based on investment portfolios and is not registered as an investment advisor in any jurisdiction. Information included in this report is derived from many sources believed to be reliable but no representation is made that it is accurate or complete, or that errors, if discovered, will be corrected. The authors of this report have not audited the financial statements of the companies discussed and do not represent that they are serving as independent public accountants with respect to them. They have not audited the statements and therefore do not express an opinion on them. The authors have also not conducted a thorough review of the financial statements as defined by standards established by the AICPA.
This report is not intended, and shall not constitute, and nothing herein should be construed as, an offer to sell or a solicitation of an offer to buy any securities referred to in this report, or a “buy” or “sell” recommendation. Rather, this research is intended to identify issues portfolio managers should be aware of for them to assess their own opinion of positive or negative potential.
No comments:
Post a Comment