The Secular Bull Market Continues
Disclosure: I have no positions in any stocks mentioned, and no plans to initiate any positions within the next 72 hours.
Back in February I mentioned that we're in a secular bull market for a variety of reasons:
*Housing Improvement
*Valuations Still Relatively Cheap
*Potential Rebound in Japan & Europe (latter still pending)
*Excessive negativity
Since that time the market is up about 5% and importantly, we're at all time highs in every major market in the US. In my opinion, the market still has a good deal more upside over the next few years as housing continues to improve and as the more mature overseas economies like Europe and Japan improve. There is still a good deal of skepticism in the markets but people are finally beginning to accept that the S&P isn't going back down to the 600s like so many permabears wanted people to believe.
So far, Q1 2013 earnings reports are showing a 4% increase in earnings for the S&P 500. Earnings are coming in better than forecast as estimates for bottom-line growth were as low as 1.5% on April 1, just 4 weeks ago. So far sixty-nine percent of the companies that have reported have so far beat analysts' earnings targets.
While revenues have been weak with about 50% missing the sales targets, a large chunk of this comes from the energy sector, which has seen a 16.7% decline in revenues due in large part to lower energy prices. Oil prices were on average 10% lower in Q1 2013 than Q1 2012. I would argue that this is a good thing for consumers and companies outside the energy sector. The performance in the iShares Dow Jones Transporation Index (IYT) for one clearly reflects this as companies like United Parcel Service (UPS), Fedex (FDX) (despite its recent fall), and JB Hunt (JBHT) are up 13%, 8%, and 29%, respectively, in the past year. All three of these companies have huge fuel expenses.
Housing Continues to Lead the Way
While home values continue to increase, the volumes were until recently lackluster. This has changed recently, though. Take a look at the chart below of new single family home sales:
(click to enlarge)
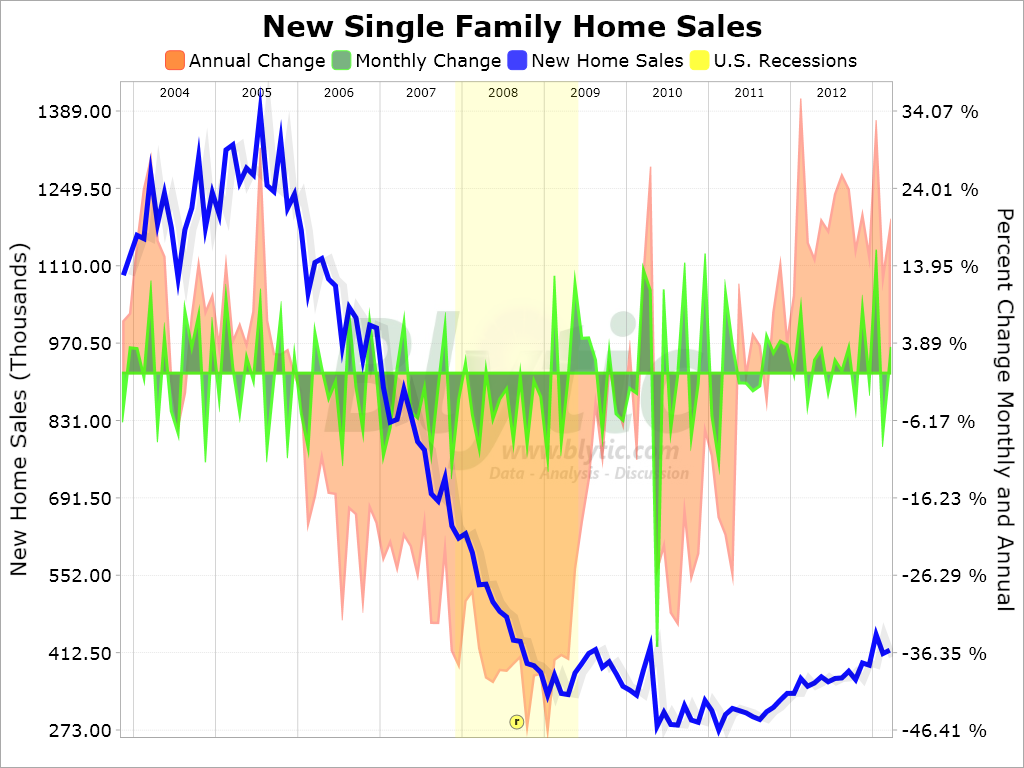
The recent uptick looks minimal in the face of the massive downdraft from 2005 to 2010. However, the percentage increases are impressive: the US Department of Commerce reported that March 2013 seasonally adjusted sales of 417,000 single family homes was up 18.5% over March 2012. Inventory at 153,000 units is at a 47 year low. In looking at the chart above, there is still significant upside remaining, especially when you consider household formation over time creating additional demand and how that demand compares to a market with all time lows in supply.
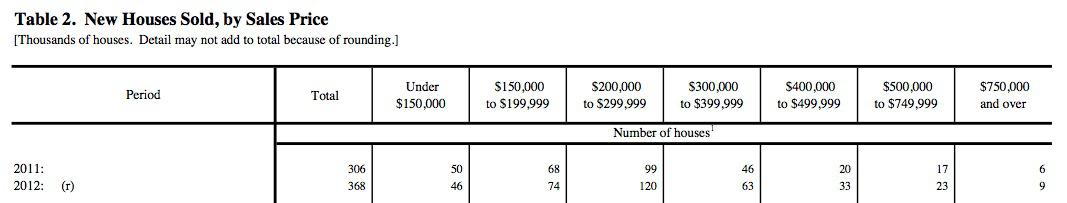
Every segment of the housing market saw improved volumes in 2012 except for homes priced under $150,000. See the chart below from the US Department of Commerce:
(click to enlarge)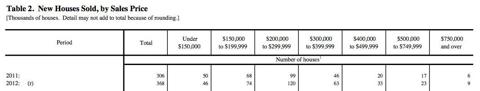
What's better is that interest rates still remain near all time lows and the housing affordability is near all time highs. American homeowners are paying significantly less of their monthly income toward mortgage payments than they did in the pre-bubble years of 1985 to 1999,according to a new study by Zillow.com. They are paying a mere 12.6 percent as of Q4 2012, down from 19.9 percent in the pre-bubble time frame.
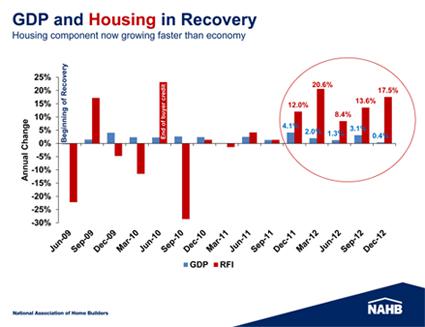
Housing is no longer a drag on the economy, but rather it is outperforming the overall economy and will be a tailwind for the US for years to come. Take a look at the chart below comparing housing with GDP:
UBS (UBS) recently released a report detailing how new household formation and the gap between that and the supply of houses could unleash pent up demand for everything from homes to weddings. I completely agree with this report and think it is a major tailwind for the economy and the markets over the next several years.
Sentiment Still Not Great
The number of "gurus" and analysts looking for a correction is still quite high. I don't have the figures on this but you can tell by the general skepticism every time there is a down day in the markets. People generally believe the rally is over and the doomsayers come storming out on CNBC.
What I can look at, though, is the University of Michigan Consumer Sentiment reports to get a gauge for how the average person feels about our economy (and therefore markets). Take a look at the longer term chart of consumer sentiment:
(click to enlarge)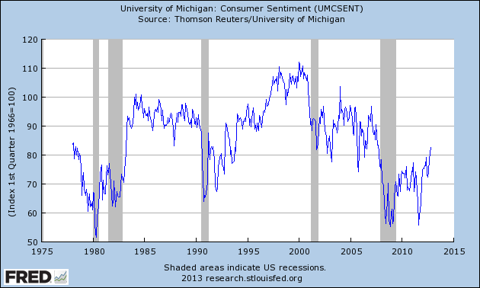

This chart was actually as of late 2012 and consumer sentiment has since retreated a little bit as you can see below:
(click to enlarge)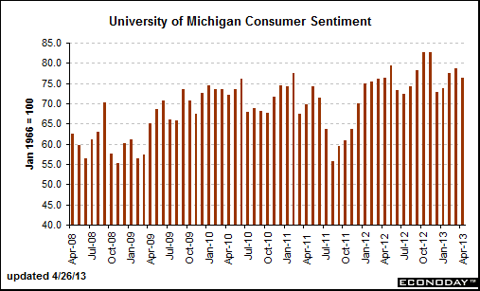
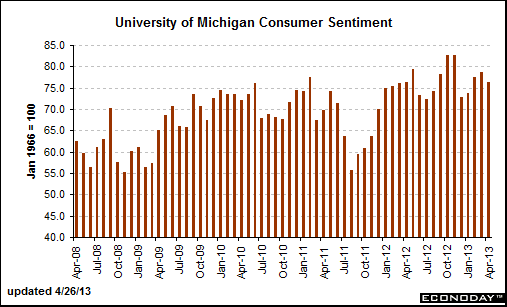
The current reading of 76 is still far away from 90 to 100 levels reached in the 1980's, 90's, and 2000's before the markets peaked. I still think there is a long way to go until people start feeling euphoric about things and this is a good thing for the general direction of the markets.
Valuations are Reasonable
Valuations are still ok, with the current p/e of around 14.8 some 8% below historical averages over the past 50 years. Below is a chart of the p/e's, from low to high, over the past 50 years, excluding the top and bottom 3 years to give you a sense of where we currently stand:
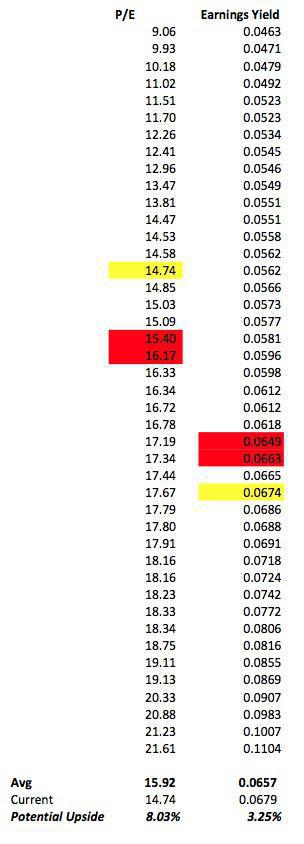
I still believe we are in the midst of a secular bull market. I think housing will help fuel bottom line earnings to 120+ for the S&P 500 by 2016 and the market will trade at 16 to 17 times earnings. That yields an S&P 500 of 2,000 by then. I think it's wise to continue considering stocks that are reliant upon a stronger domestic US economy.
No comments:
Post a Comment