How To Use Bond ETF Data To Trade Stock Index ETFs
Disclosure: I have no positions in any stocks mentioned, and no plans to initiate any positions within the next 72 hours.
One of the most useful concepts when constructing trading strategies is the idea that key markets are related and interconnected. This concept is particularly applicable when creating strategies to trade stock index ETFs such as the SPDR S&P500 Index Trust (SPY).
The stock and bond relationship - Fundamental concept review
On one side, asset managers see stocks and bonds as their primary asset allocation options. Indeed, many investment programs (Pension funds, mutual funds, and structured ETFs) are based upon the idea that the investor should maintain a constant percent allocation to each of these asset classes.
For example: One of the most common asset allocation schemes is the, "60% stocks, 40% bonds" allocation. Some "lifecycle" funds attempt to provide a "one-stop choice" for retirement planning. They operate by gradually increasing the allocation to bonds as the "retirement date" approaches. Such funds might start at 80% stocks, 20% equities, and end up with 20% equities, 80% bonds at the retirement date. On the other side, bond prices (and hence interest rates) directly impact the rate at which corporations are able to borrow. All else equal, lower interest rates decrease borrowing costs, which increases profits and corporate valuations.
Large moves in the relative price of stocks and bonds trigger a whole host of necessary re-balancing activity at asset management firms. This is due to the need to maintain a desired asset allocation, and also because the relative desirability of each investment class changes as prices change. Large, persistent changes in the relationship also alter the fundamental conditions of corporate valuation. This is true both at the macro level, and also at the individual firm level (For example, the acquiring firm with the lowest cost of capital can afford to pay the highest rational price).
Trading application
With these fundamental concepts covered, let's think about how this relationship might be helpful in simple trading terms. In order to have a predictive relationship, we know we can only use data that is available at the time the trading decision is made (we can't use today's change in bond prices to predict today's change in stock prices).
Let's start by simply evaluating how yesterday's (open-to-close) change in the iShares Trust Barclays 20+ Year Treasury Bond ETF (TLT) might affect today's return in the SPDR S&P500 ETF. For the purposes of this study, we will be looking at the historic results from trading 1000 share positions.
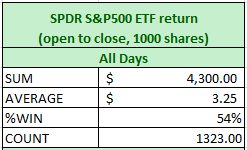
First, let's find the open-to-close return for all days in our study period. This can be used as a benchmark when evaluating our bond ideas. Here it is:
Our understanding is that a larger move in bonds might require a larger need for re-balancing. We also know that a larger move up in bond prices means lower interest rates, which in turn impacts corporate values. Considering this, let's evaluate how the results change if we look at the SPY ETF return when bonds were up or down yesterday by greater than one full point:
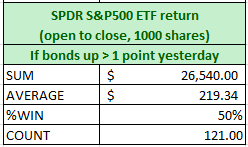
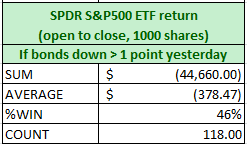
What we see is that after bonds were up yesterday by over one point, the SPY ETF's return today increased significantly. The impact was symmetrical on the other side: After bonds decline by over one point, the SPY ETF's return the next day was significantly negative.
Let's add a factor from the price behavior of the SPY ETF to our study. What if the S&P 500 was down yesterday by over .5 points, and bond prices were up by greater than one point? Here are the results:
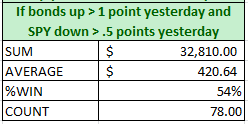
If you have read my other stock index trading articles (or have studied the market yourself), you know that on average, the expected return for the current day has historically gone up after a down day, and down after an up day (See here). During our five-year test period, buying after a down day boosted today's SPY return from $3.25 to about $138 per 1000 shares traded. With the two ideas working in conjunction (as demonstrated above), the average profit per trade is up to $420, which is extremely high for this type of historical study.
Let's do one more evaluation. We know that after a lower close in the S&P500 futures yesterday, the return is on average higher today. We also know that when stocks close lower and bonds are up one by over one point, the average return the next day has increased higher still. What has happened when stocks closed down "yesterday" by over .5 points, and bonds closed down by greater than one point?
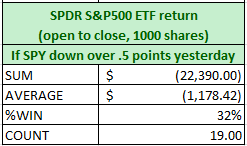
Even though we have only 19 trading events, I find these results to be extremely interesting. Out of a sample with an above-average return (buying after a down day), the "bonds down +1, stocks -.5 points" idea has created a significantly negative return. At the very least, the above suggests that tracking bond price moves might be very handy for those who are looking to buy dips in stock index ETFs or looking for short-sell signals.
The stock-bond relationship is a fundamental economic concept that can yield many potentially profitable insights. These tests are just the tip of the iceberg in terms of potential patterns. Keep in mind, though, that it is always important to update studies and observations regularly. Basic conditions (and patterns) change over time.
If you have read my other trading strategy articles, you should have more than a few ideas about how these results can be improved upon and extended. By the way: when I write these articles, I often get questions about how I evaluate trading strategies. This article is my answer to that question.
Good Trading!
4 comments:
Great Information for Forex Trading! Get Demo Account of upto $10000. Trusted Forex Brokers. Best Customer Support.
Great Post! thanks for sharing useful information with us. If you want to know more about this topic, then click on the below links.
Thank You!
Currency Trading
Equity Market
Forex Trading
Forex Market
It's very interesting, Thanks for sharing a valuable information to us & Knowledgeable also, keep on sharing like this.
Stock Investor provides leatest Indian stock market news and Live BSE/NSE Sensex & Nifty updates.Find the relevant updates regarding Buy & Sell....
ShareTrading
Demat Account
Equity Trading
Stock Trading
Thanks for sharing. Really useful information and it’s a great article with good resources. Checkout our Stock Investor website for more latest stock market update.
Bharat Bhushan Finance & Commodity Brokers Share Price
Bharat Bijlee stock price
Bharat Dynamics stock price
Bharat Electronics stock price
Post a Comment