S&P 500's P/E Down To 16.1x: A Tale Of Two Markets
The S&P 500 (SPY) was down 2.1% last week as more companies reported Q1 earnings. So far, 104 companies in the S&P 500 reported and 70 beat estimates. Looking under the surface, consumer staples companies continue to perform well and lead the index. The decline last week brings the S&P 500's P/E multiple down to 16.1x (based on LTM operating earnings). The multiple is high compared to the last few years, but low on a multi-decade timeframe. The key question remains: will earnings accelerate in Q1?
In this article, I will examine the earnings results and estimates for the S&P 500 as well as its P/E multiple. I will also focus on the top 100 companies and highlight sector trends. Under the surface, it looks like a tale of two markets with a clear distinction between the winners and the losers.
S&P 500 Price Action
The S&P 500 ended the week just below a key trend line that I have been watching, but bounced off the 50 day moving average.
(click to enlarge)
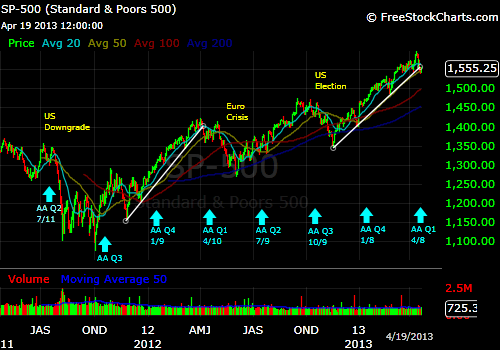
(Source: FreeStockCharts.com)
S&P 500's Q1 2013 Results So Far
As of April 18, 104 of the companies in the S&P 500 reported earnings and 70 beat estimates. The financials sector had the largest amount of companies reporting. Most of the big banks delivered Q1 results that were good, but not great. Their stocks subsequently drifted lower, but the reaction has been muted.
(click to enlarge)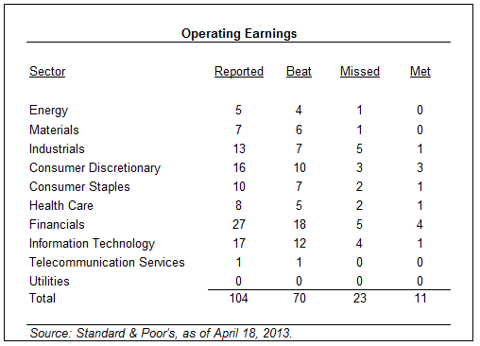

S&P 500 P/E Multiple & Earnings Estimates
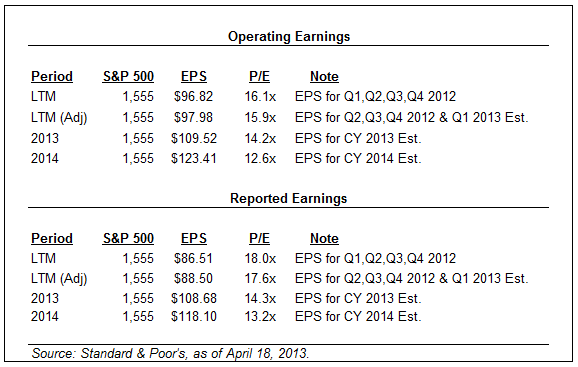
There are several ways to look at the P/E of the S&P 500, including trailing/forward earnings or operating/reported earnings. Here is a look from different angles.
(click to enlarge)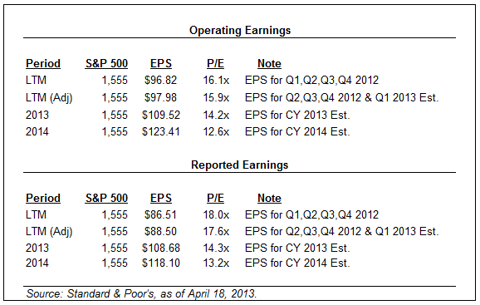
Estimates for Q1 operating earnings were down slightly last week to $25.40 from $25.49 the previous week. This probably reflects a combination of reported results and last minute changes to estimates.
(click to enlarge)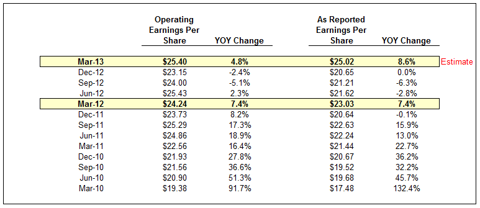

Looking at the S&P 500's multiple on various time frames gives a mixed impression. On a long-term timeframe (first graph) it looks low, but on a short-term timeframe (second graph) it looks high. The current multiple could be used by both the bulls and the bears in their arguments about the market's next move.
Earnings momentum is probably more important now than the valuation level. The current multiple could be justified if Q1 earnings show an acceleration in earnings growth after a few lackluster quarters. However, if earnings disappoint again, the market will likely sell off and only find buyers at a lower valuation level.
Please note that the last data points in the third and fourth graphs are estimates and will change as the numbers come in. The graphs show the expectations for growth, but it is too early to tell what the actual results will be.
(click to enlarge)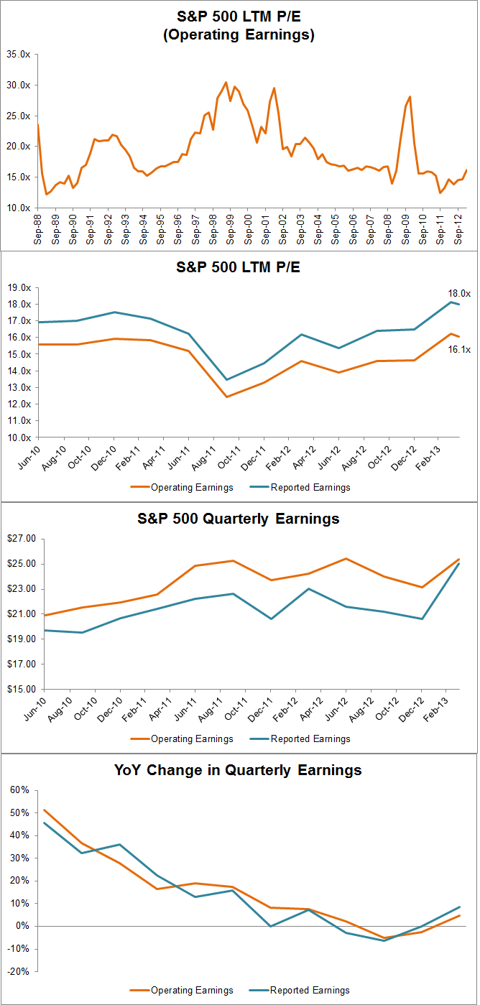

(Source: Standard & Poor's)
Focus On The Top 100 In The S&P 500
Every week I like to drill down on the top 100 companies and see what is driving the S&P 500. These companies represent 64.6% of the value of the S&P 500 and matter the most on an individual basis.
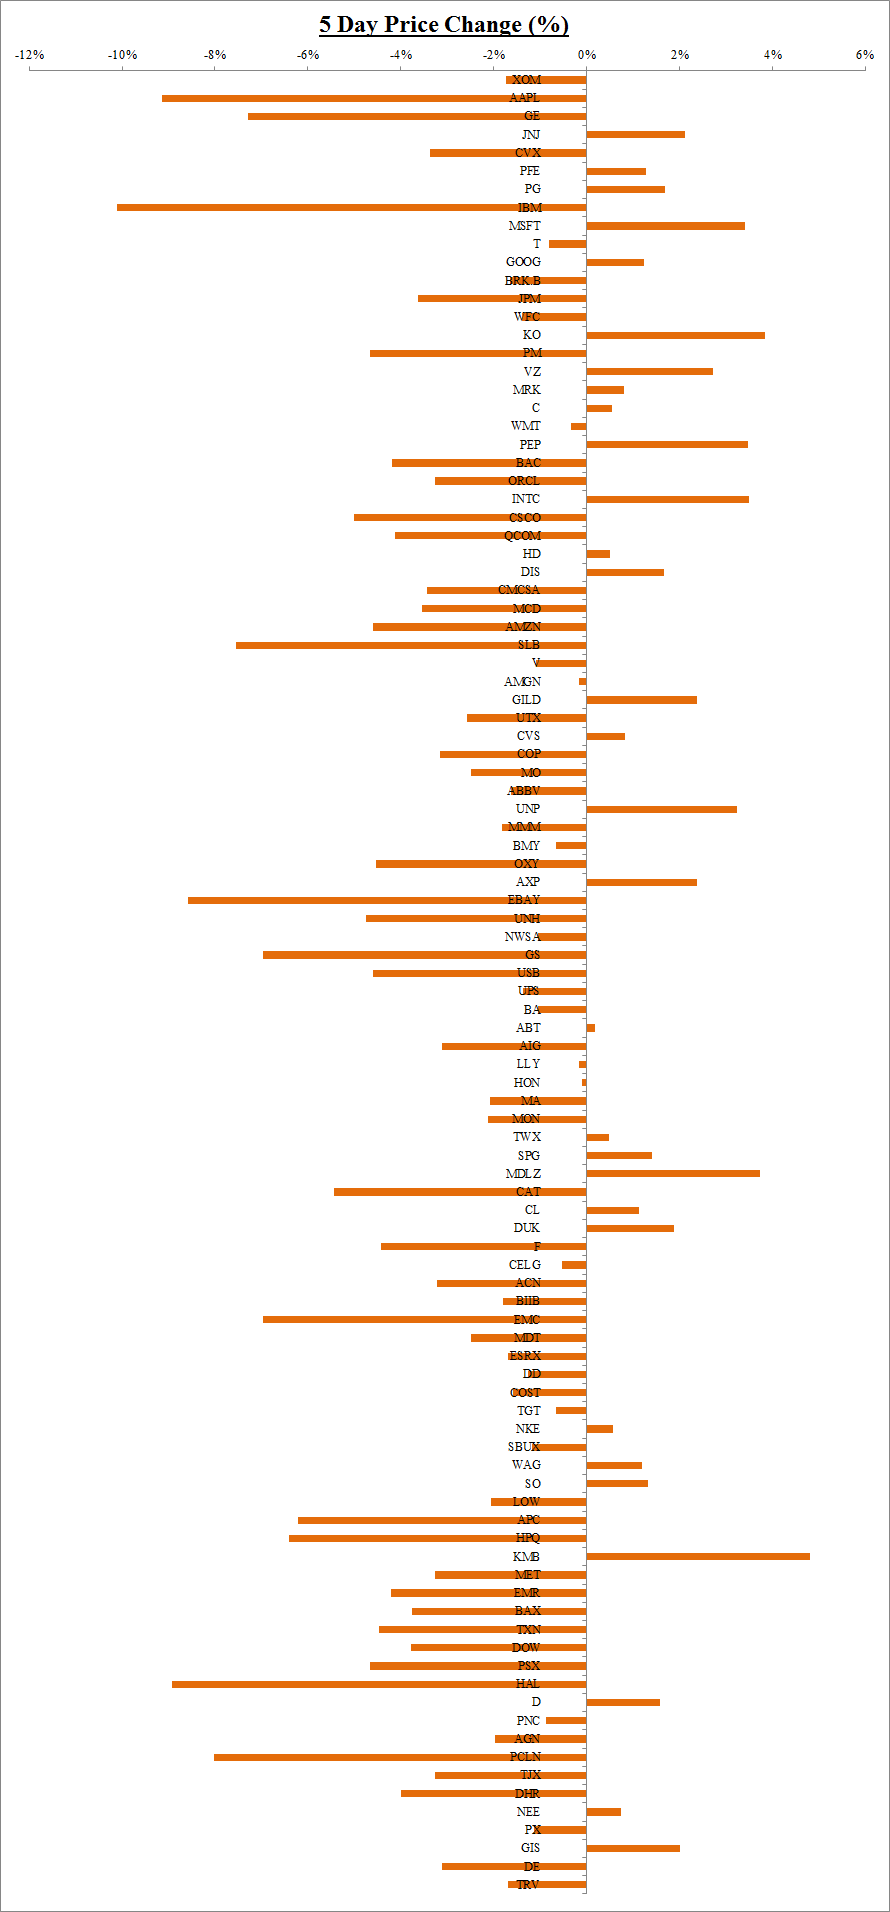
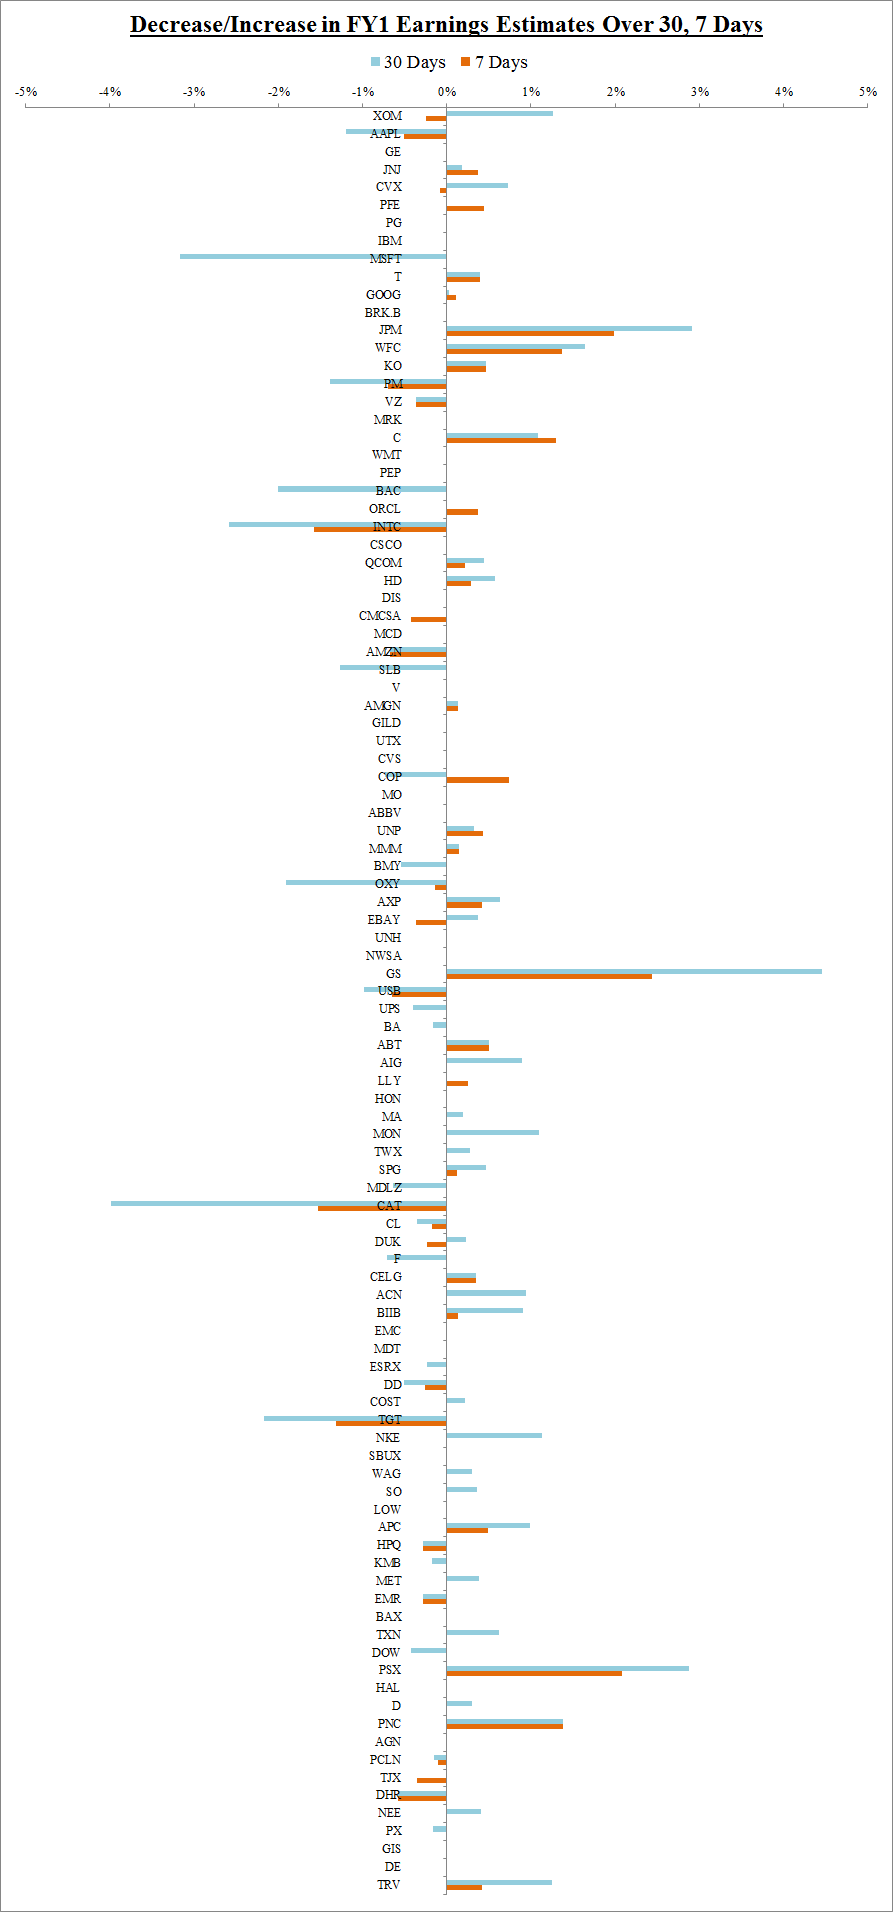
Below are four charts about the top 100 companies in the S&P 500: (1) 5-day price change, (2) forward P/E multiples, (3) analysis of companies with FY1 P/E multiples lower or higher than the median for the group and (4) changes in analyst estimates for FY1 over the last 7 and 30 days. The following are key takeaways from this data.
The relative price action over the last 5 days clearly shows the leadership of the defensive stocks. Among the big winners for the week were Coca-Cola (KO), Mondelez (MDLZ) and Kimberly Clark (KMB). Healthcare stocks also continue to lead the market.
The technology and commodities sectors produced a lot of laggards. Key underperformers for the week were Apple (AAPL), IBM (IBM), EBAY (EBAY) and Halliburton (HAL).
Earnings results were the main catalyst for the price action last week and will likely continue to be for the next few weeks.
Next week a number of important companies will report results, including Apple, Exxon (XOM) and Caterpillar (CAT). As the second largest component in the S&P 500, and a big underperformer over the last few months, Apple's results will likely have a big impact on the price action of the overall index. Exxon and Caterpillar will give investors more insight into the energy and commodities sectors, which have also been lagging.
The consumer staples stocks have P/E multiples that are on the high side compared to the other top 100 companies in the S&P 500. Coca-Cola, Mondelez, Kimberly Clark and many other defensive stocks stand out on the third chart, which compares the P/E multiples for the group. The solid performance of these companies should continue to support high multiples, but it is hard to argue that there should be a lot more multiple expansion for these companies.
This week I presented the earnings estimates for the current fiscal year (see fourth chart), instead of the current fiscal quarter. The financial sector stands out with several key companies experiencing positive revisions to earnings expectations recently, including: JPMorgan (JPM), Wells Fargo (WFC), Citigroup (C) and Goldman Sachs (GS). These companies already reported Q1 earnings, which seem good, but not great. However, expectations for the big banks have been low.
(click to enlarge)
(click to enlarge)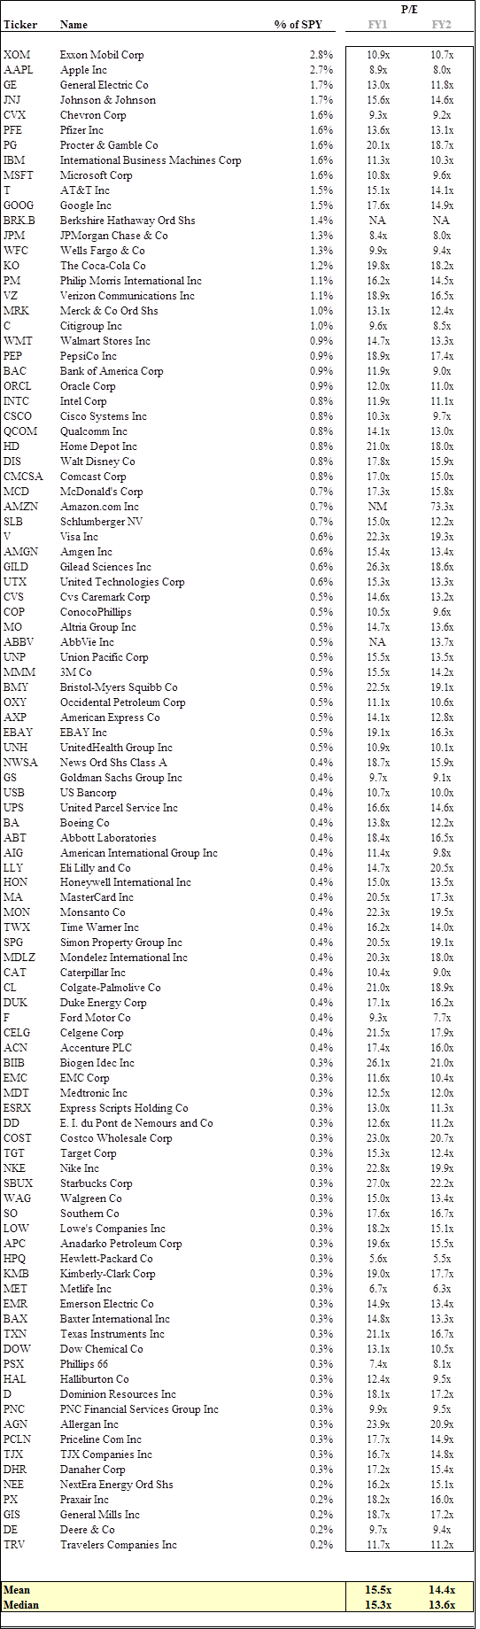

(click to enlarge)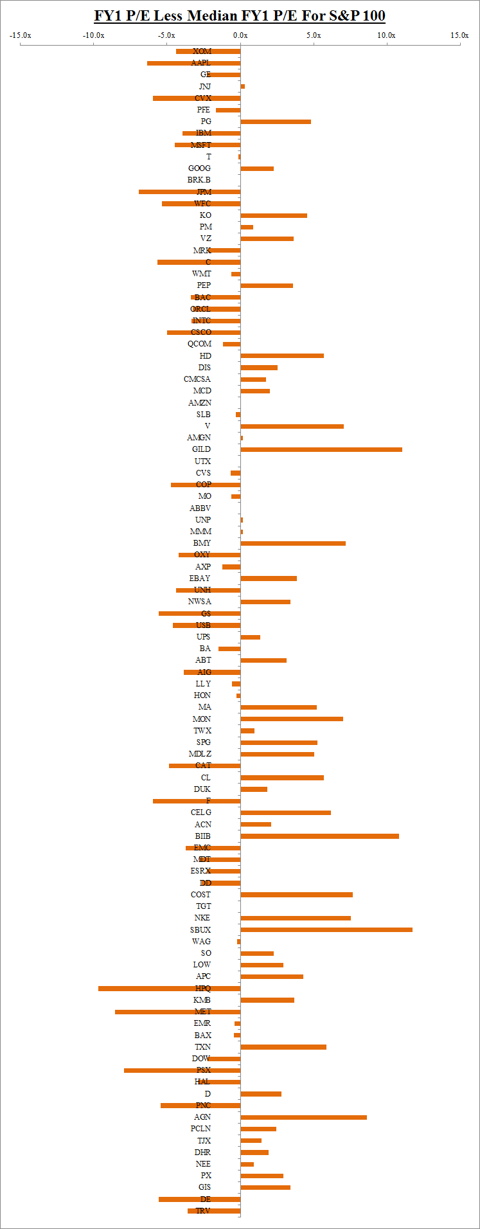

(click to enlarge)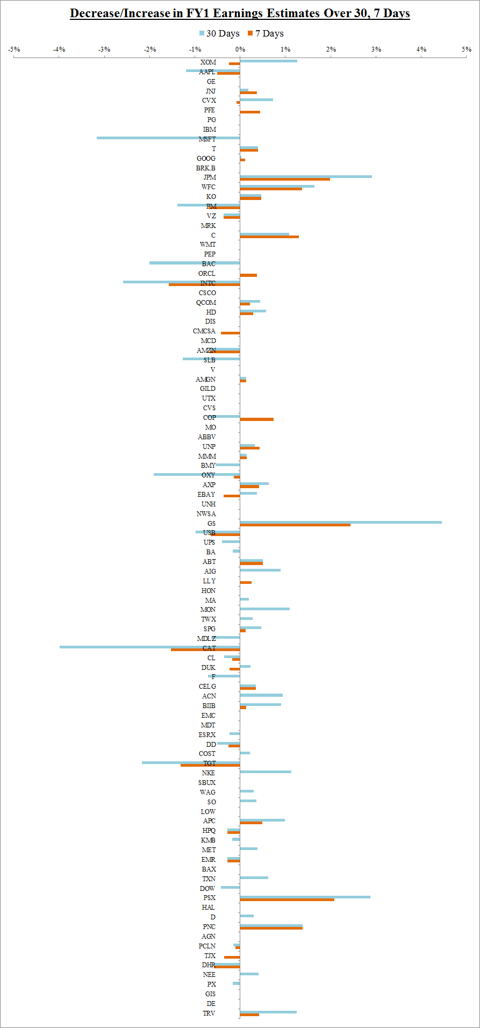
(Source: Yahoo Finance, see further notes below)
Conclusions
The S&P 500 saw declines and increased volatility last week. However, the 104 companies that reported so far came in with good results and the overall P/E multiple is not high on a long-term timeframe.
Under the surface, it is a tale of two markets. The defensive, consumer staples stocks are clear leaders and delivered good earnings results. Technology and cyclical companies continue to lag.
Several key tech companies disappointed already, including IBM, but we will get more earnings results next week from this sector, especially the widely anticipated results from Apple.
It will be interesting to see how the financials perform going forward. JPMorgan, Goldman Sachs and some of the other big banks had decent earnings results and expectations for the fiscal year have been rising. We'll see if they can again lead the market like in the second half of 2012.
Notes
The tables exclude the following: P/E multiples greater than 100 and P/E less Median values greater than 50. Additionally, some information about Amazon, Berkshire Hathaway, AbbVie, Mondelez and Abbott Laboratories was not available.
The mean and median figures presented in this article represent the unweighted mean and median of the metrics for the 100 components in the SPDR S&P 500 ETF Trust and are not capitalization-weighted like the index itself.
Earnings Estimates are based on data from Yahoo Finance as of April 20, 2013.
Disclosure: I am long F, WMT, GOOG, BAC, AIG, SBUX, C. I wrote this article myself, and it expresses my own opinions. I am not receiving compensation for it (other than from Seeking Alpha). I have no business relationship with any company whose stock is mentioned in this article.
Additional disclosure: I may trade and of the securities mentioned in this article at any time, including in the next 72 hours.
Disclaimer: The opinions expressed above should not be construed as investment advice. This article is not tailored to specific investment objectives. Reliance on this information for the purpose of buying the securities to which this information relates may expose a person to significant risk. The information contained in this article is not intended to make any offer, inducement, invitation or commitment to purchase, subscribe to, provide or sell any securities, service or product or to provide any recommendations on which one should rely for financial, securities, investment or other advice or to take any decision. Readers are encouraged to seek individual advice from their personal, financial, legal and other advisers before making any investment or financial decisions or purchasing any financial, securities or investment related service or product.
Information provided, whether charts or any other statements regarding market, real estate or other financial information, is obtained from sources which we and our suppliers believe reliable, but we do not warrant or guarantee the timeliness or accuracy of this information. Nothing in this article should be interpreted to state or imply that past results are an indication of future performance.
There are no warranties expressed or implied as to accuracy, timeliness, completeness, or results obtained from any information in this article or any linked website.
No comments:
Post a Comment