Summary
- SPY appears to be very expensive when compared to the GDP.
- When comparing the level of corporate profits to GDP, it appears that the U.S. market is generating very high levels of profits.
- The crash at the start of the century displayed very weak earnings.
- Extremely low yields on high-quality debt present two distortions to the market - enhancing earnings and reducing investment options.
- The question going forward will be one of the sustainability of earnings. If earnings are sustainable at this level, the market is being fairly valued.
When considering the state of the economy, it is all too common to see a focus on all the wrong things. Investors know that the SPDR S&P 500 Trust ETF (NYSEARCA:SPY) is considered a substitute for the market in most finance classes. Previously, I disproved the myth that SPY was the efficient frontier of the market. Despite those issues, it is still far better than most investors will come to creating a truly efficient portfolio.
What should an efficient portfolio look like? I'm still working on designing mine, but I've shared my current holdings. In May, I'll run another piece with the latest updates. My biggest area for addition has been international holdings through ETFs.
The landscape is changing
I read a piece recently that had me thinking about the future of the economy. Charles Sizemore, CFA pointed out the high valuation of the market relative to GDP. I've been reading a few of his ideas because it keeps me thinking about the market from a top-down perspective instead of a bottom-up perspective. As an analyst, it is common to build our expectations from projections for firms, rather than to start with the economy on a very broad level. In that article, he presents the following chart.
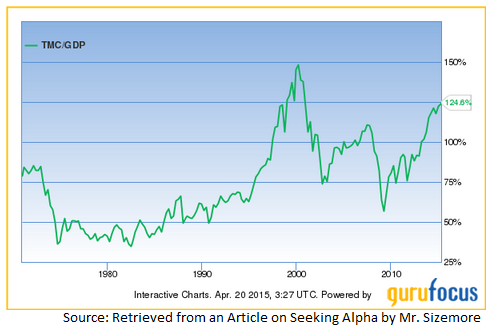
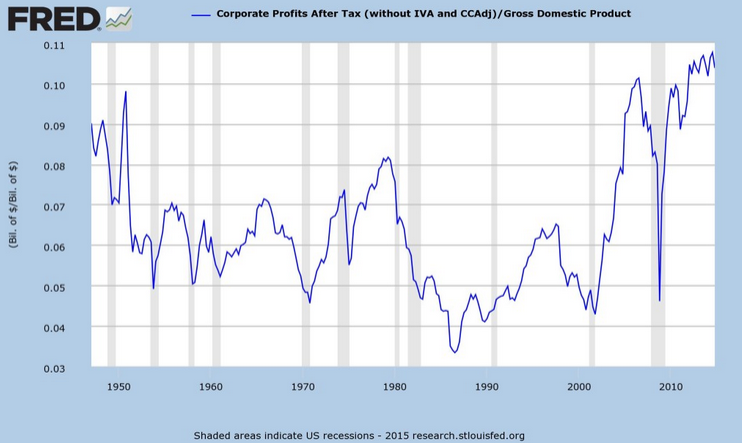
In the current economy, we are seeing TMC (Total Market Cap) to GDP (Gross Domestic Product) reaching very high levels. However, we are not seeing P/E ratios (on a broad level) hitting absurd valuations. The issue is that corporate profits are hitting levels that I would consider absurd. The following chart by the St. Louis Fed demonstrates that point. This chart was also brought to my attention courtesy of Mr. Sizemore's articles.
(click to enlarge)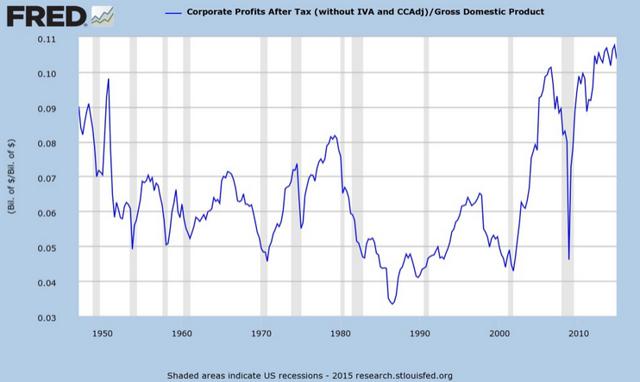
The P/E theory
When we start questioning whether the market is hitting a "top" or if we are "in bubble territory", we would be wise to remember the history.
The P/E issue can be clearly seen in the bubble around the year 2000. The first chart shows that the valuations of the market relative to GDP were very high in 2000. The second chart shows that corporate profits after taxes were very low in 2000. I built the following chart using data from multpl.com. Since I haven't used the source before, I can't guarantee the accuracy of the data. The data provides the P/E ratio of the S&P 500 since about 1871. That isn't a typo. Here is my chart.
(click to enlarge)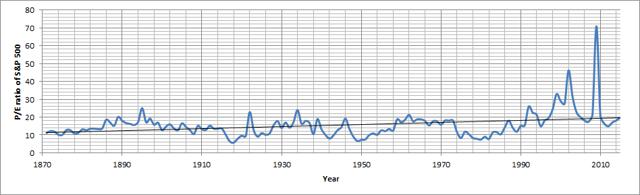

The chart is confirming the idea that the P/E ratios around 2000 were at unprecedented levels. We witnessed higher P/E ratios during the latest crash, but I believe that was more of an abnormality with recognizing losses. The second chart showing the incredible reduction in earnings for the year that immediately bounced back supports my explanation. When the three charts are used together, a more complete picture is formed.
We are not repeating the same old mistakes; we are making new ones
The sharp difference between the current highs and the ones seen before the bubble burst at the start of the century is that this time, we are seeing enormous corporate profits that can be used to pay dividends, repurchase shares, or invest in new productive assets. Quite simply, the current market is worth more than the old market, because the companies are actually making money. There is a world of difference between an investor "making money" by having a stock go up and a company "making money" by producing an item of value and selling the item for a profit.
Courtesy of very low interest rates, we are seeing two distortions in the market. The first issue is that corporate earnings are higher than they would be under normal interest rate scenarios, because lower interest rates reduce the amount of interest that must be paid on any given amount of debt. The second issue is that investors seeking wealth do not have any option for high-quality debt offering respectable yields on holding until maturity. Sorry, the long-term rates on treasury yields are not attractive for investments unless the investment can be funded with short-term debt or as a play on the yield curve inverting and creating capital gains. However, I won't go off into the yield curve in this article. The simple case is that a lack of attractive debt investments is driving up the value of equity by enhancing earnings and limiting the options available to investors.
What if corporate profits are sustainable?
In my opinion, if corporate profits are not sustainable, then the market is overvalued. However, I believe there is a great opportunity for further research into the sustainability of corporate earnings over the next few decades. In future articles, I'll be diving into my views on some of the factors that will influence long-run earnings growth rates.
My positions
At the present time, I'm concerned about the valuations of the market as demonstrated by SPY; however, I have a fairly substantial long position in the Vanguard Total Stock Market Index (NYSEARCA:VTI), which has about a 99% correlation with SPY. I'm also holding a position in the Fidelity Spartan® Total Market Index Fund (MUTF:FSTVX), which has about a 99.7% correlation to VTI. I'm not big on holding large amounts of cash, but I will use my expectations for future growth to determine which markets to invest in. Because of my concerns about the valuations on SPY, I'm choosing to increase the percentage of my portfolio in international assets. My most recent acquisition was the Vanguard Global ex-U.S. Real Estate ETF (NASDAQ:VNQI), which, I believe, should represent a small holding in my portfolios due to the diversification benefits. I wrote about VNQI before purchasing it.
Because I believe the current valuations have very little in common with the bubbles in 2000 and 2007, I'm not selling my shares in VTI. I am simply choosing to focus on adding to new investments in foreign markets at a faster rate than I'm adding to my investments in domestic markets.
Additional disclosure: Information in this article represents the opinion of the analyst. All statements are represented as opinions, rather than facts, and should not be construed as advice to buy or sell a security. Ratings of "outperform" and "underperform" reflect the analyst's estimation of a divergence between the market value for a security and the price that would be appropriate given the potential for risks and returns relative to other securities. The analyst does not know your particular objectives for returns or constraints upon investing. All investors are encouraged to do their own research before making any investment decision. Information is regularly obtained from Yahoo Finance, Google Finance, and SEC Database. If Yahoo, Google, or the SEC database contained faulty or old information, it could be incorporated into my analysis.
No comments:
Post a Comment