skip to main |
skip to sidebar
July 2010 Trade Balance


Highlights
- After subtracting over three percentage points from GDP growth in the second quarter, trade data from July suggests that the net exports contribution may completely reverse itself in the third quarter.
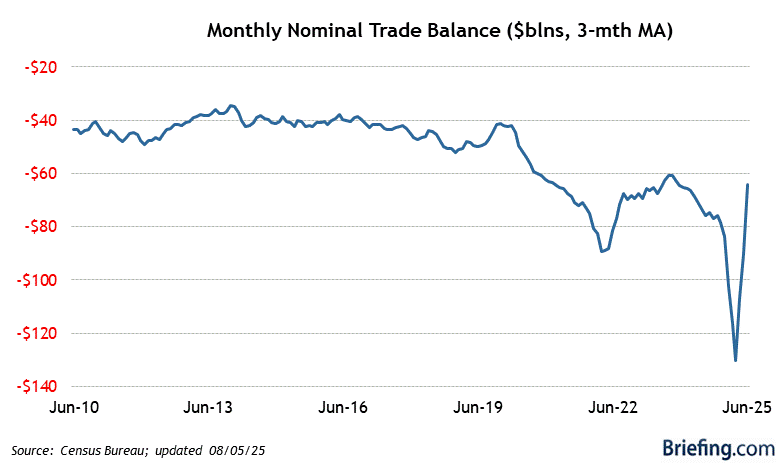
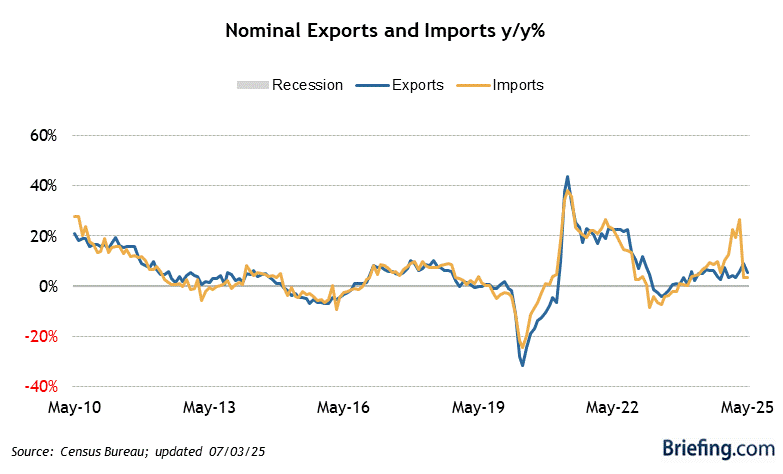
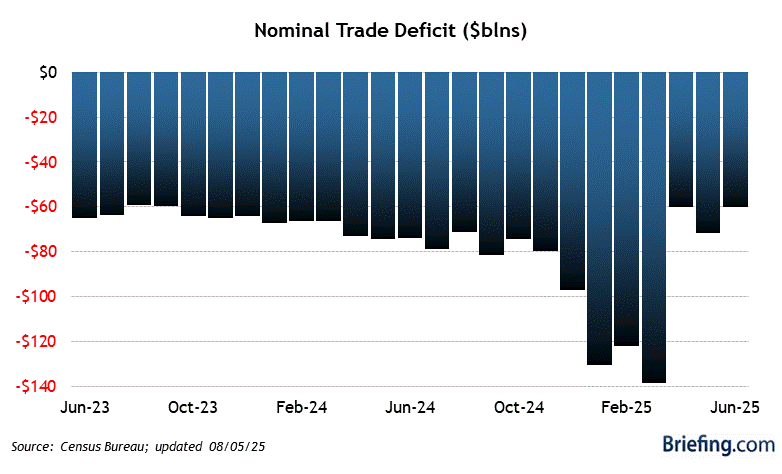
- The U.S. trade deficit declined from $49.8 bln in June to $42.8 bln in July as exports increased by $2.8 bln and imports fell by $4.2 bln. The Briefing.com consensus called for the deficit to fall to $47.3 bln.
Key Factors
- The goods deficit fell by $7.0 bln to $55.2 bln while the services surplus remained unchanged at $12.5 bln.
- Unfortunately, the details of the data do not paint a picture of strong economic growth. Altogether they speak to slowing demand in the U.S. that reflects more of a low-growth scenario.
- In the export sector, 50% of the growth (+$1.4 bln) was due to a 61.5% increase in civilian aircraft shipments. Typically, a gain of this magnitude is followed by a similar contraction next month.
- In the import sector, industrial supplies and materials, which are necessary inputs for continued growth in manufacturing, fell by $0.44 bln and suggest that manufacturers have already stockpiled all of the inputs needed for expected demand.
- Further, capital goods imports fell by $0.58 bln as demand for imported business investment waned.
- As expected, consumer goods imports dropped by $1.9 bln as gem diamond imports returned to normal levels and consumers shunned purchases of foreign durable goods.
Big Picture
- The trade deficit can be thought of as a Catch-22 situation for the US economy. A drop in the deficit has resulted from import demand declining at a faster rate than the decline in export demand. The result was an increase in GDP growth without any actual increase in output. The recent rise in the deficit was the result of both exports and imports growing, but with imports outpacing exports. We are now experiencing an increase in output, but GDP is negatively affected. The trade-off of more production for negative GDP growth is better than the reverse and we'll take the increasing deficit as a signal of a stronger economy.
| Category | JUL | JUN | MAY | APR | MAR |
| Trade Deficit | $42.8B | $49.8B | $41.8B | $40.0B | -$40.0B |
| Exports | $153.3B | $150.6B | $152.6B | $148.8B | $149.8B |
| Imports | $196.1B | $200.3B | $194.4B | $188.9B | $189.9B |


No comments:
Post a Comment