Some of the readers of my last article on volatility suggested that the trading model I outlined focused too much on the spot price of the VIX and not enough on the contango effect. Others berated me for suggesting going long the iPath S&P 500 VIX Short Term Futures TM ETN (VXX) in certain situations and that my recommendations are a big money loser. I think they are both right and I am writing this article in the hopes that I can rectify my standing with those two camps. While I agree that a long-term buy and hold of the VXX is not a good idea, I do believe that every person that invests his own money is at his core a trader and a little bit of a gambler; if you don't find the idea of taking occasional shots at making a big return on a VIX spike appealing then you might as well go and plant flowers in the backyard. Trading is a risky business and the return is commensurate with the risk taken. However, most people do prefer a buy and hold approach with capital preservation of utmost importance and the goal of this article is to outline a buy and hold strategy for volatility trading.
VIX Contango Comet
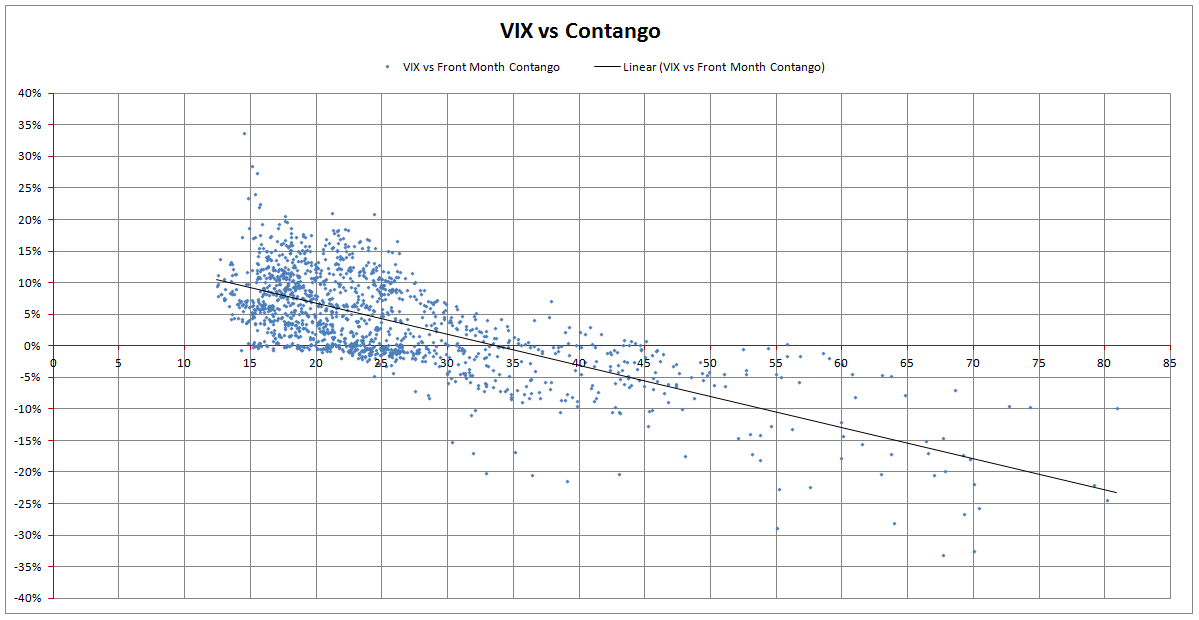
I decided to dig a little bit deeper into the contango effect. While there are terrific articles on Unraveling the VXX Roll Yield Riddle, I want to focus more on figuring the parameters of when to get into a trade and when to get out. I agree that contango, more specifically the front-month contango, and spot price of the VIX have to be taken into account together before making a trading decision. The front-month contango is the difference in the price of the current month's VIX futures contract and next month's VIX futures contract. Since the volatility ETFs and ETNs sell the current month VIX futures contract and buy the next month VIX futures contract, the front-month contango is of utmost importance. I was able to get VIX front-month contango data (from here on I'll just call it "contango") from June 21, 2007 to February 15, 2013. This is almost 6 years worth of data that encompasses the end of the bull market in 2007, the financial crisis in 2008, the recovery of 2009, the European debt crisis debut in 2010, the US downgrade fiasco of 2011, the choppy election year of 2012, and of course, all the bullish action in between these episodes. This is a nice compilation of years that combine good and bad times and will provide us with a good objective look into the interplay between VIX and contango.
(Click to enlarge)
This scatter graph plots the VIX vs. contango for 1425 trading days. What becomes immediately obvious is that for the most part the VIX is between 10 and 30 and that the contango is mostly positive. In fact, this is true 65% of the time. There seems to be a loose linear relationship between the VIX and contango. The data is not exactly stuck to the regression line but there does seem to be a relationship. The higher the VIX, the higher the chance that the contango will be negative. In fact, for VIX values over 45, there are only 2 positive contango days, the other 84 days are strictly negative. However, a higher VIX doesn't automatically mean a lower contango. The cluster around the head and the looseness of the tail is why I call it the VIX Contango Comet. 65% of the time, the action is in the head of the comet where the VIX is low and the contango is positive which means for the long-term you want to be a buy and hold investor of the VelocityShares Daily Inverse VIX Short Term ETN (XIV).
For your information, I have put together some other interesting statistics from the VIX Contango Comet:
Average Contango
|
4.17%
|
Standard Deviation
|
7.58%
|
2 StDev Above
|
19.33%
|
1 StDev Above
|
11.75%
|
1 StDev Below
|
-3.41%
|
2 StDev Below
|
-10.99%
|
Min Contango
|
-33.03%
|
Max Contango
|
33.75%
|
Average Negative Contango Steak
|
8 days
|
Average Positive Contango Streak
|
21 days
|
Longest Negative Contango Streak
|
76 days
|
Longest Positive Contango Streaks
|
178 days
|
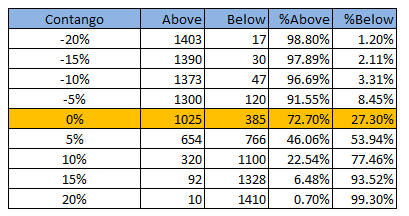
These are the odds of the contango being above or below certain thresholds:
And here are the longest consecutive streaks:
Longest Negative Contango Streaks (days)
1st: 76 (8/1/2011 to 11/15/2011)
2nd: 63 (9/12/2008 - 12/10/2008)
3rd: 54 (1/15/2008 - 4/10/2008)
4th: 39 (1/7/2009 - 3/11/2009)
5th: 26 (11/7/2007 - 12/13/2007)
Longest Positive Contango Streaks (days)
1st: 178 (6/30/2010 - 3/14/2011)
2nd: 145 (5/31/2012-12/27/2012)
3rd: 126 (11/16/2011-5/17/2012)
4th: 91 (6/19/2009-10/30/2009)
5th: 83 (3/16/2011-7/13/2011)
I was very surprised at how long the longest negative contango streak was. 76 trading days is almost 4 months. If you are invested in the XIV at that time, the backwardation will be eating your money faster than Kobayashi can eat hot dogs. You might as well pull the money out, buy yourself a box of cigars and use the remaining Benjamins to light them up. At least you will be putting the money to some practical use. As with anything, there is no free lunch and XIV can bite you just as hard as the VXX if you are not careful.
VIX, Contango and the Nonfarm Payrolls Report
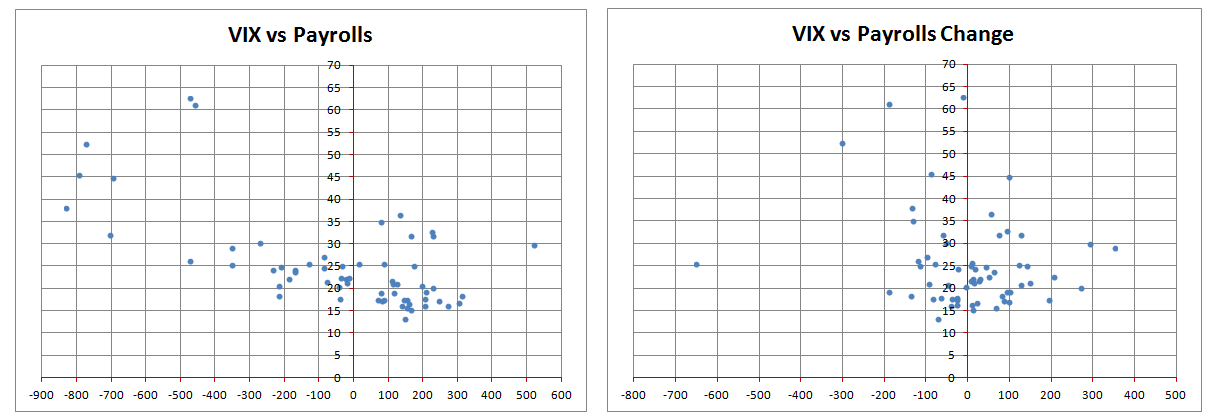
The most important market moving economic indicator each month absent some catastrophic event like Lehman is the Bureau of Labor Statistics Employment Situation report. It is the most widely followed report by the financial media and it comes out in the first week of every month. The seasonally adjusted monthly nonfarm payrolls report sets the table for trading during a given month more so than any other economic indicator and as such I think it strongly affects the value of the VIX. I have taken all VIX and contango data and averaged them for a given month and then compared them against the nonfarm payroll release for the prior month. I have made comparisons against the actual payroll number as well as the change in payrolls. Here are scatter graphs of these comparisons:
(Click to enlarge)
(Click to enlarge)
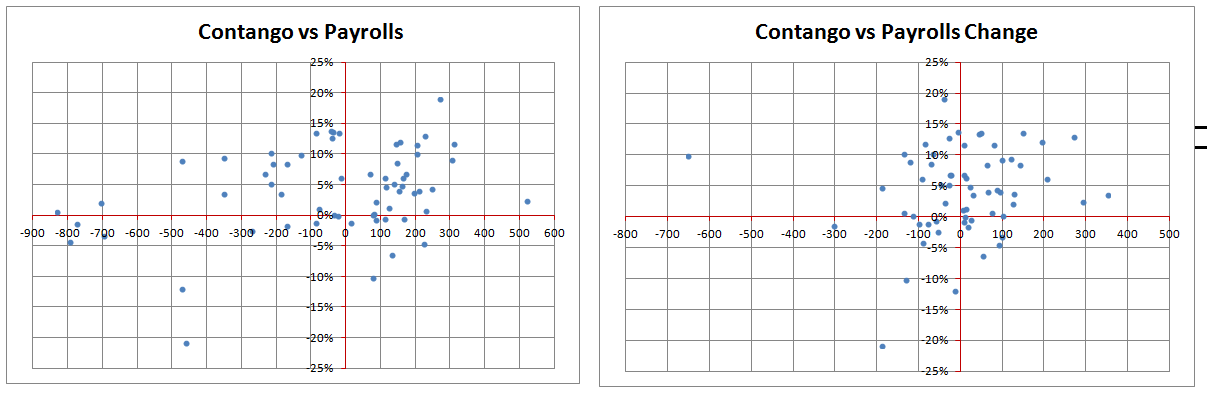
Clearly, the more positive the payroll number, the lower the VIX is and the more positive the contango is, although the relationship is not strictly linear. Generally, the same relationship exists for change in payrolls. I have summarized the above graphs in these two tables that show ranges for payrolls and number of months in which the average contango was positive or negative:
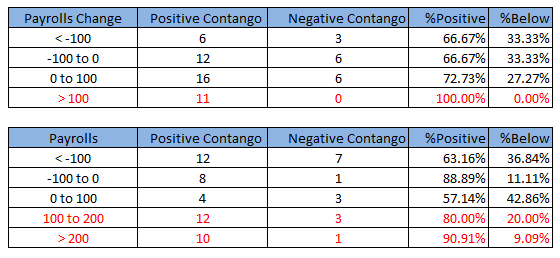
(Click to enlarge)
Since contango is 70% of the time positive, months with negative payrolls will experience periods with positive contango. However, in red above, we can find the sure bets. When payrolls change is above 100K jobs, contango is 100% of the time positive and when actual payrolls are above 100K, there is an 85% chance of having positive contango. So if the monthly jobs report is in excess of 100K or the payroll number is 100K higher than the prior month, you might as well go out and buy the XIV. This month (May 2013) is one such month for example as the nonfarm payrolls clocked in at 165K although the change from the prior month was only 27K.
VIX Contango Oscillator
But why stop here? How about we look at a simple chart of the VIX vs. contango over the entire period for which I have data. This is by far my favorite chart:
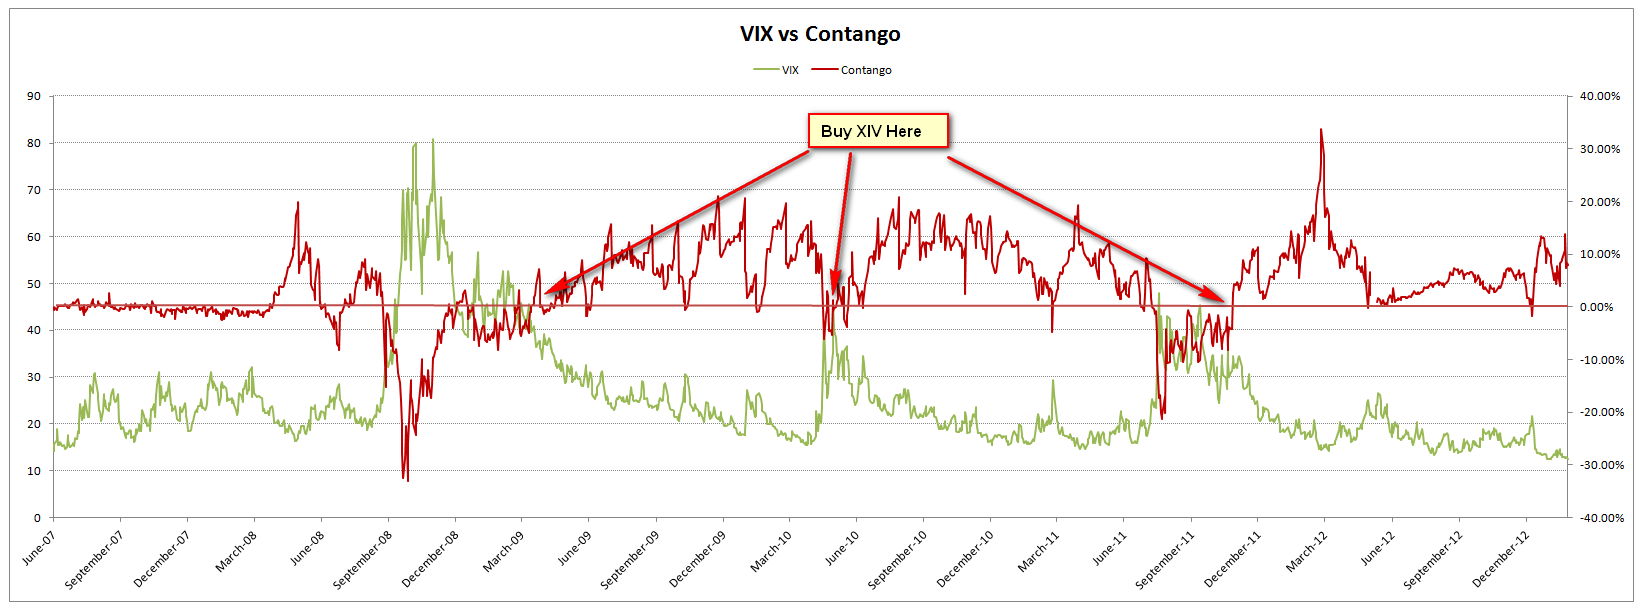
(Click to enlarge)
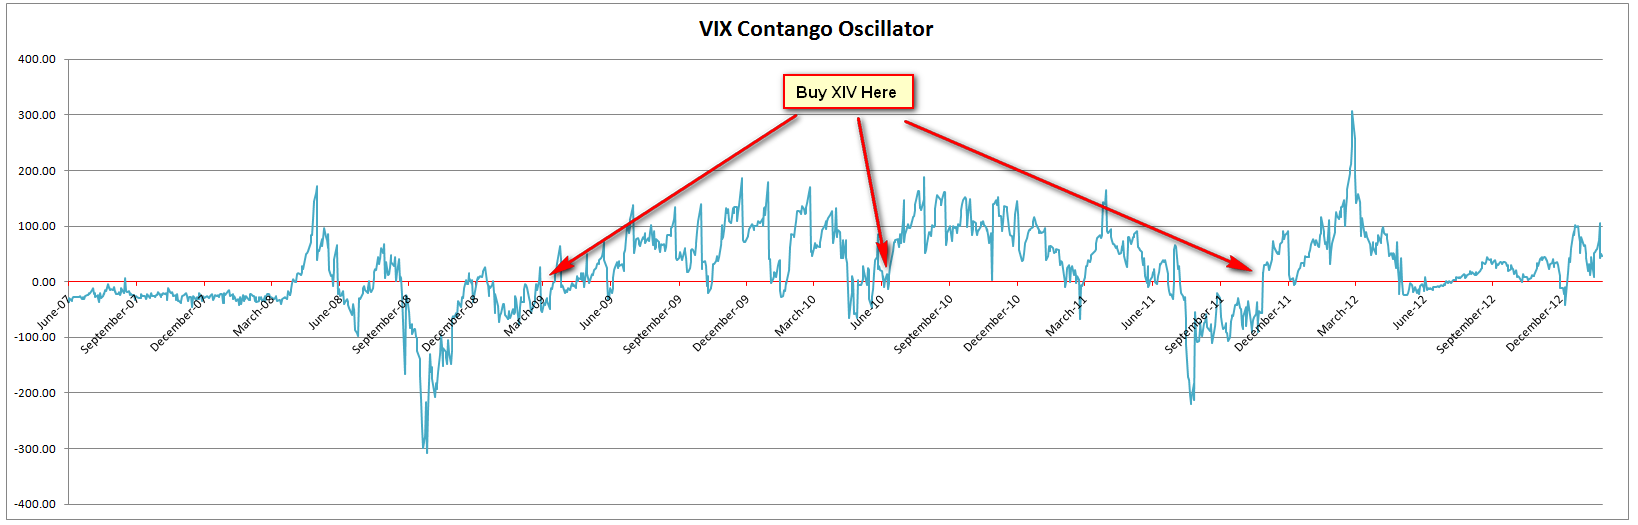
Clearly it shows that contango is for the most part positive, although it does tend to go negative for long periods of time during times of extreme market duress. Big dips in the contango are present during the aftermath of the Lehman bankruptcy and after the rating downgrade of US treasury debt from AAA status. Negative contango also coincides with spikes in the VIX. The best time to buy the XIV is when the VIX is coming down from elevated levels and the contango turns from negative to positive. On the chart above, when the VIX and contango lines intersect that seems to constitute an XIV buy signal. To make this buy signal even more clear, let's create a composite data series that combines the VIX and contango using the following formula and plot it against time:
VIX Contango Oscillator = VIX -45 + 1000 * Contango
(Click to enlarge)
A XIV buy order should be placed when the VIX Contango Oscillator goes from an extended negative streak into positive territory. You can also place buy orders when the oscillator touches the axis and bounces back into positive territory. If it goes negative for more than a couple trading days, you might want to consider closing your XIV positions. When it hits zero again and goes positive, then buy the XIV again. And if you are an adventurous gunslinger, then you might want to consider buying yourself some VXX when the oscillator goes into negative territory for a couple of days. But make sure to close out of your positions quickly if the oscillator bounces back into positive territory.
To illustrate the profitability of this strategy, let's look at the XIV against the VIX Contango Oscillator. The XIV was started on November 30, 2010 so I can only go back that far. The shaded areas show when you should be invested in the XIV based on buy and sell signals from the oscillator:
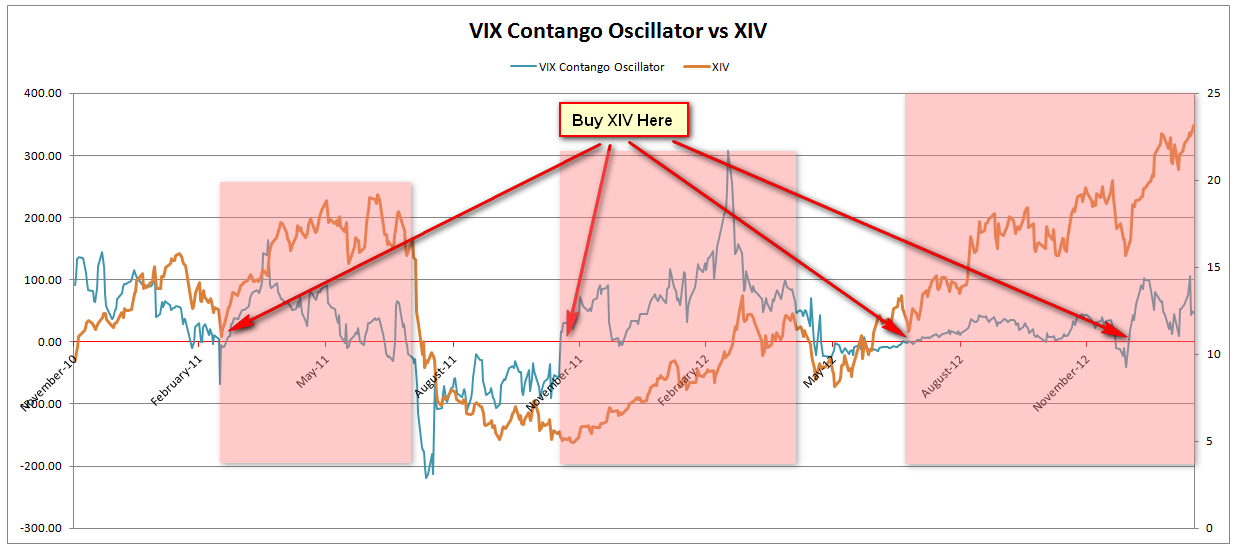
(Click to enlarge)
There were 3 fairly stress free opportunities to double the money you have allocated to volatility trading using XIV over the past 3 years. Are you going to catch the next one?
P.S.
You can get today's front month contango value from VIXCentral.com:
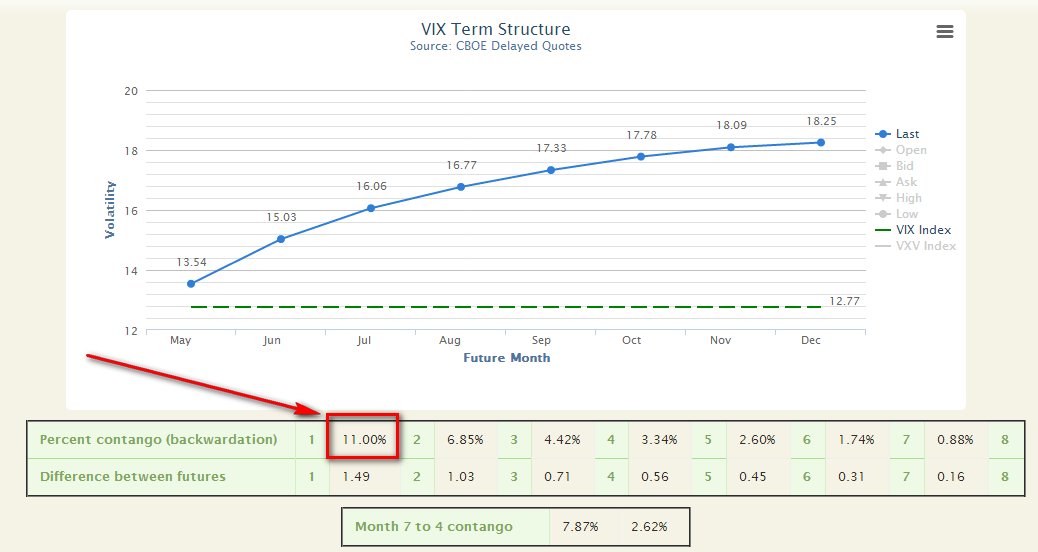
(Click to enlarge)
No comments:
Post a Comment