Summary
- Some analysts claim stocks are cheap, others argue stocks are expensive. Which one is it?
- P/E ratios vary depending on calculation method. Discussed are two and why they may be altogether worthless.
- There is one "non-fudgeable" valuation metric: dividends.
By what standard are analysts measuring stock market valuation? There must be different "standards," because stock market valuation is a passionately fought and never-ending debate. Some analysts say that stocks are overvalued, others argue they are cheap. How can that be, and who is right?
This article will review three different valuation metrics, each plotted against the S&P 500 (timeframe: from 1881-2013; datasource: Robert Shiller), and two variables that make P/E analysis almost worthless.
Valuation Metric #1: 12-month Trailing P/E
Figure 1 shows the S&P 500 P/E ratio based on 12-month trailing "as reported" earnings.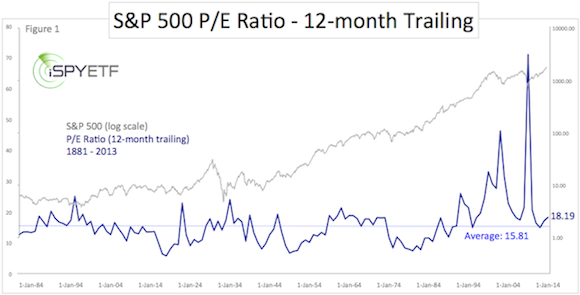
As of December 31, the 12-month trailing as reported P/E was at 18.19 (18.91 today).
The 134-year average is 15.81. The highest reading was 123.79 (May 2009), the lowest reading was 5.31 (December 1917).
Based on this P/E metric, the S&P 500 (SNP: ^GSPC) is 19.6% overvalued (compared to its 134-year average).
Valuation Metric #2: Cyclically Adjusted P/E
Figure 2 shows the S&P 500 Cyclically Adjusted P/E ratio (CAPE). The CAPE is based on average inflation-adjusted earnings from the previous 10 years (formula: take the annual EPS of S&P 500 for the past 10 years. Adjust EPS for inflation using the CPI. Take the average of inflation adjusted EPS figures over the 10-year period. Divide the current level of the S&P 500 by the 10-year average EPS).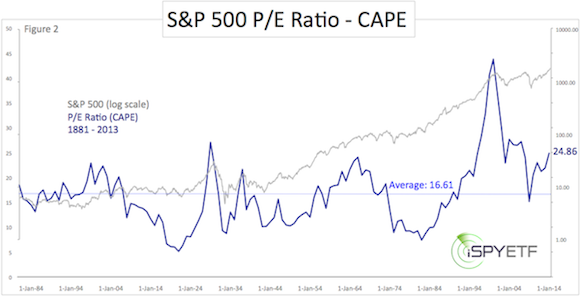
As of December 31, the CAPE was at 24.86 (25.62 today).
The 134-year average is 16.61. The highest reading was 44.20 (December 1999), the lowest reading was 4.78 (December 1920).
Based on the CAPE, the S&P 500 (NYSEARCA: SPY) is 54.24% overvalued.
Valuation Metric #3: Forward (Imaginary) P/E
The forward P/E is based on forecasted (or projected) earnings. Wall Street analysts are generally optimistic, and most optimistic towards market peaks. As such, earnings forecasts are often inflated, resulting in depressed P/E ratios.The current S&P 500 P/E based on projected earnings is 15.80. This P/E doesn't have a 134-year history, but here is what Factset says about the forward P/E:
"The current 12-month P/E ratio is stil below the 15-year average (16.0). During the first two years of this time frame (1999 - 2001), the forward P/E ratio was consistently above 20.0, peaking at around 25. With the forward P/E ratio still below the 15-year average and not close to the higher P/E ratios recorded in the early years of this period, one could argue that the index may still be undervalued."
Is P/E Ratio Analysis Worthless?
There are two problems with P/E ratio based valuation analysis:1) Corporations can and often do fudge their balance sheets (such as FASB rule 157). More details about one of the biggest loopholes here: The Simple Trick that Ruined the P/E Ratio for Everybody.
2) Multiple expansion: Multiple expansion is a fancy term for investors' willingness to overpay for stocks. Some research suggests that 70% of bull market returns are based on multiple expansion.
To wit. In January, one high-flying tech stock was trading with a P/E ratio of 1,403. The January 5 Profit Radar Report featured this little tidbit:
"Trivia: Which high-flying tech leader has a P/E ratio of 1,403? Tip: This stock is the fourth biggest component of the Nasdaq-100. Answer: Amazon (AMZN). Amazon founder Jeff Bezos is a true visionary and Amazon is working on amazing technology, but ultimately earnings are more important than pure vision. A close below 380 would open the door for much lower targets."From January to May, AMZN lost as much as 30%. Willingness for "multiple expansion" creates bubbles, and there's no telling when bubbles start or end. It's a wild card. Ultimately, a stock is worth as much as investors are willing to pay for it, regardless of its P/E ratio.
The "Non-Fudgeable" Valuation Metric
Investors are irrational and corporations can cook the books, but one gauge that can't be fudged are dividends. Dividends are either paid, or not.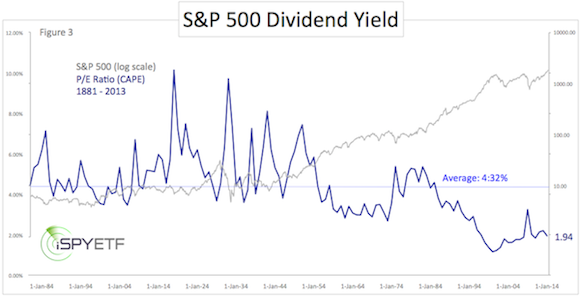
The S&P 500 dividend yield was at 1.94% on December 31 (1.91% today).
The 134-year average is 4.32%. The highest yield was 13.84% (June 1932), the lowest yield 1.11% (August 2000).
Based on dividend yields, the S&P 500 is 55.79% overvalued.
Conclusion
Each of the above charts is plotted against the S&P 500, providing a clear visual that valuations don't work as short-term market timing tools. What does work as short-term timing tool?Here is a closer look at a fascinating type of analysis that's pegged the recent S&P 500 moves:
No comments:
Post a Comment