Disclosure: I am long SPY.
Thanks for reading the seventh installment of equity/fixed income momentum strategies. This article discusses the historic return profile of momentum strategies between fixed income and equity classes, and gives an overview of the reasons behind last month's relative performance and a look forward to relative returns in July. Two months ago this series was discussing yields on long Treasuries hitting new year-to-date lows in April while the S&P 500 (SPY) hit new all-time highs. Fast forward, and long Treasuries are near their highest yield levels in two years after yesterday's strong payroll numbers. Given the rapidly evolving market environment, this article will discuss implications for relative returns in the near future.
The purpose of this series of articles is to demonstrate the success of these strategies, and give Seeking Alpha readers with differing risk tolerances tips on how to employ these strategies themselves to improve the performance of their balanced portfolio. These are useful strategies for Seeking Alpha readers, especially those who allocate dollars to their investment plan on a subscription basis, like 401(k) investors making automatic payroll deductions. These switching strategies can be used to adjust periodic allocations to capture the momentum effect and improve portfolio returns, especially in tax-deferred accounts.
Treasuries/S&P 500
The most basic momentum strategy involving the equity and fixed income markets is between the benchmark Treasury index (GOVT) and the S&P 500. This monthly strategy switches between the two asset classes, owning the asset class that performed the best in the trailing one-month forward for the next one month.
In difficult market environments, Treasury bonds typically rise in value as a flight-to-quality instrument while risky assets sell off. In improving economic environments, the opposite is usually true as equities rally and bonds sell-off as investors reap the returns of equity ownership and Treasury bonds are negatively impacted by rising inflationary impacts. This latter example was certainly the environment witnessed in the last two months as improving domestic data caused bond market participants to wager that monetary accommodation would be unwound earlier than previously expected, leading to a sharp sell-off in bond prices.
Below is a graph of the historical performance of the S&P 500, the Barclays Capital Treasury Index, and a momentum strategy that buys the asset class that had outperformed in the trailing one month. In these strategies, the one month holding period is a calendar month beginning with the first day of the month.
(click to enlarge)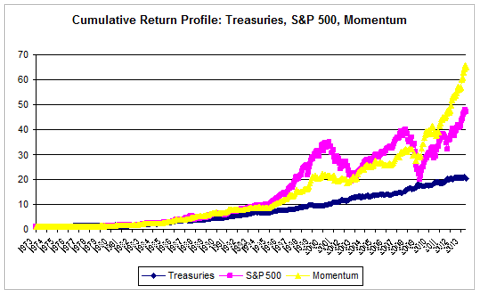

(click to enlarge)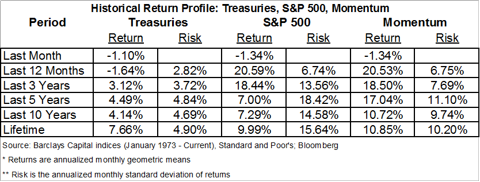
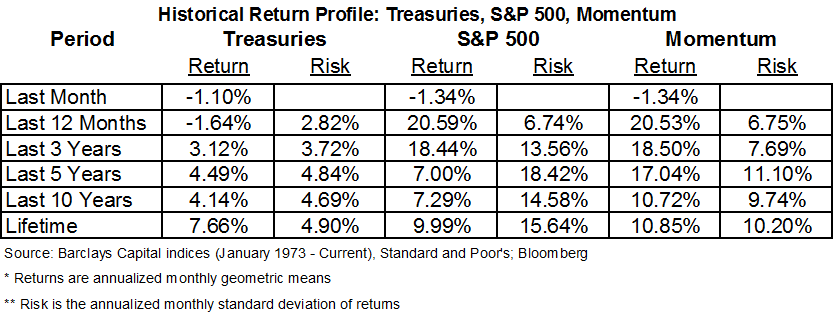
Over trailing 3, 5, 10, and 40-year time horizons, this momentum strategy has outperformed the S&P 500 with lower volatility. The results above should prove interesting to any Seeking Alpha reader trying to balance their allocation between stocks and bonds. Since 1973, when the Barclays Treasury index was first published, the momentum strategy has generated 86ps of annual outperformance versus the S&P 500 while only exhibiting roughly 2/3 of the volatility. Below is a graph of the risk/return profile of buy-and-hold portfolios with varying mixes of stocks and bonds versus this momentum portfolio historically with data through year-end 2012.
(click to enlarge)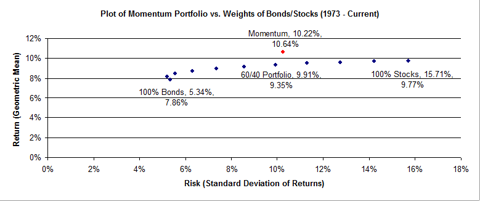
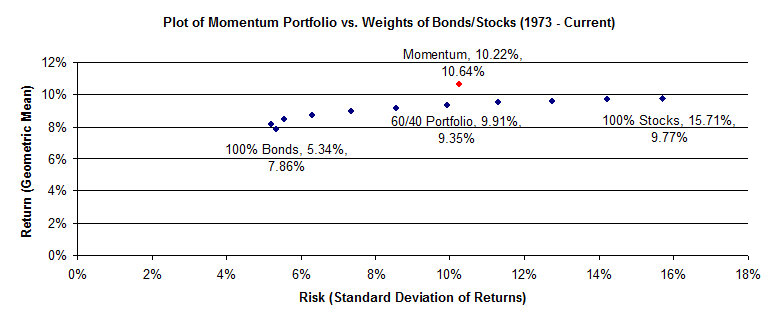
This switching strategy would have allocated to stocks just over 55% (266/480 months) of the time from 1973-2012. Instead of allocating funds in a traditional 60% stocks/40% bonds balanced portfolio, allocating to the asset class that had outperformed in the trailing one month would have seen less dollars flow to equities, but cumulatively generated roughly 130bps of average annual excess returns. Using the momentum approach to allocate funds, investors would have actually put less money into stocks over that forty-year period than investors using a 60%/40% stocks/bonds split. However, the momentum approach would have produced meaningful incremental returns with lower realized volatility.
(For a mathematical look at why Treasuries were chosen as the fixed income asset class in these equity/fixed income momentum strategies, see my inaugural article on these strategies.)
Readers wishing to implement this S&P 500/Treasury switching strategy in their own portfolio would have owned the S&P 500 in June 2013, given the outperformance versus Treasuries in May. Treasuries and equities bucked their typical trend of negative correlation as both fell by more than 1% in June. Treasuries were the lesser of two evils (although longer duration Treasuries indices fared much worse). This relative outperformance suggests that investors should want to own Treasuries relative to the S&P 500 in July. The momentum trade between Treasuries and the S&P 500 would have kept investors in equities in all six months so far in the first half of 2013, generating outperformance in each monthly period in the first half. Even as Treasuries rallied early in the second quarter, they failed to outpace the return in stocks. With Treasuries besting equities in June and yields on Treasury bonds now roughly 100bps higher than their April lows, perhaps we are seeing a short-term pivot.
Treasury Bonds/Small-Cap Domestic Stocks
The efficacy of these momentum strategies is driven by the low correlation between Treasuries and stocks as the two asset classes perform well in differing market environments. These strategies suggest that the market is slow to adjust to new information, allowing for outsized returns by following the trade that has been outperforming in short trailing periods (and maybe more importantly avoiding stocks, or risky assets generally, when markets are falling). It stands to reason that an asset class with an even lower correlation with the Treasury market historically, and higher long-run expected returns should produce a momentum strategy profile that fares even better than the aforementioned S&P 500/Treasury switching strategy. This is exactly what we find when small cap domestic stocks are incorporated.
(click to enlarge)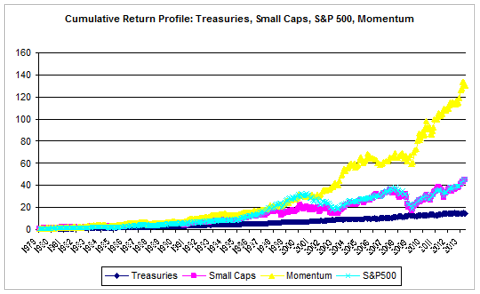
(click to enlarge)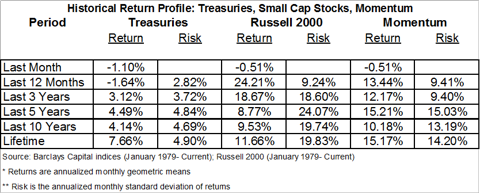
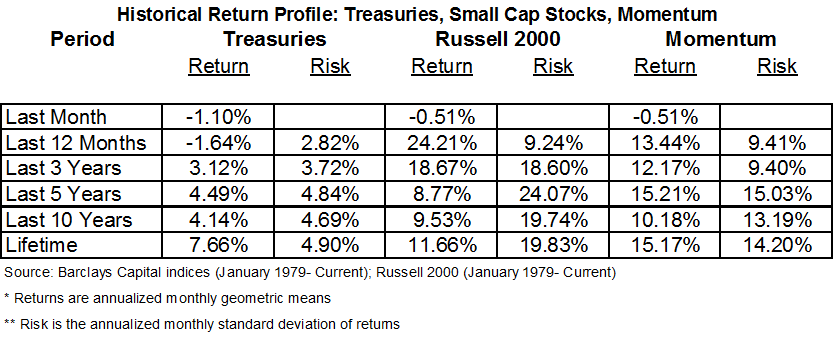
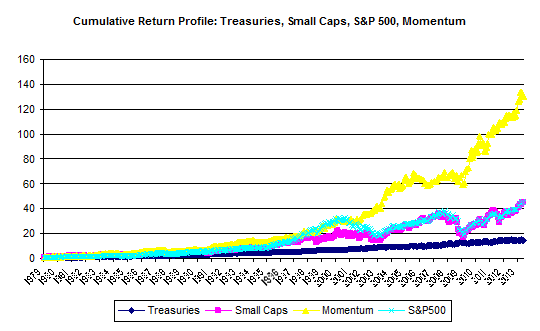
From 1979-2012, investors who employed a monthly switching strategy between small-cap stocks (Russell 2000 ETF: IWM) and Treasury bonds would have cumulatively ended the period with nearly three times as much money as those who bought and held the S&P 500. Over that time period, the switching strategy between small caps would have also had slightly less variability of returns than owning the broad equity market index outright. The Treasury index and Russell 2000 had slightly negative correlation between their return profiles over this time period (r= -0.01). Readers should take note that the Treasury/small cap switching strategy is a souped-up version of the Treasury/large cap switching strategy with 450bps of incremental average annual excess returns, but 400bps of incremental annualized volatility. In my February 2013 article, "The Small Cap Stock Index For You," I demonstrated that the S&P Smallcap 600 (IJR) is a preferable index to the Russell 2000, but use the latter index here for its longer historical track record.
Readers wishing to implement this switching strategy in their own portfolio would have owned small. This relative outperformance by small caps in June signals that small-cap stocks will extend their gains relative to Treasuries in June. In April, returns saw contradictory signals from small cap and large cap stocks given that the former group underperformed Treasuries while large cap stocks outperformed. In June, just the opposite has occurred with small caps besting Treasuries and large caps lagging.
Treasury Bonds/Emerging Market Stocks
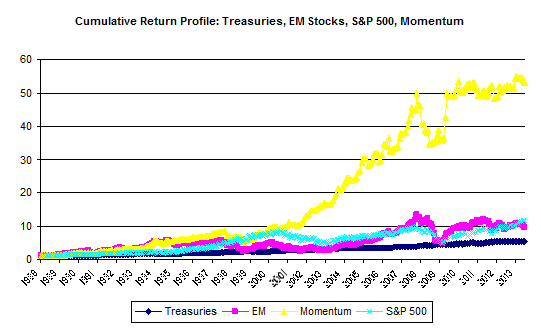
If substituting small caps for the S&P 500 further enhanced the risk/return profile of the momentum strategy historically, then moving into emerging markets should further increase both risk and expected return. With data from the MSCI Emerging Market Index (replicated through EEM) from 1989-2012, an enhanced momentum strategy is exactly what substituting emerging markets has historically produced.
(click to enlarge)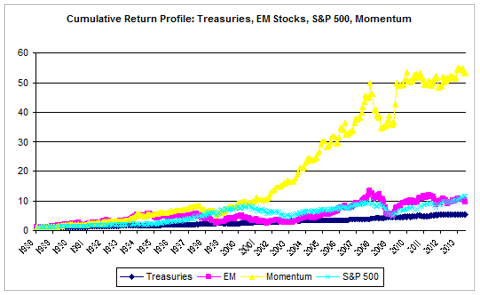
(click to enlarge)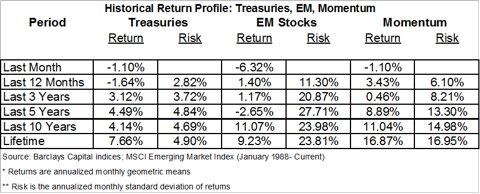
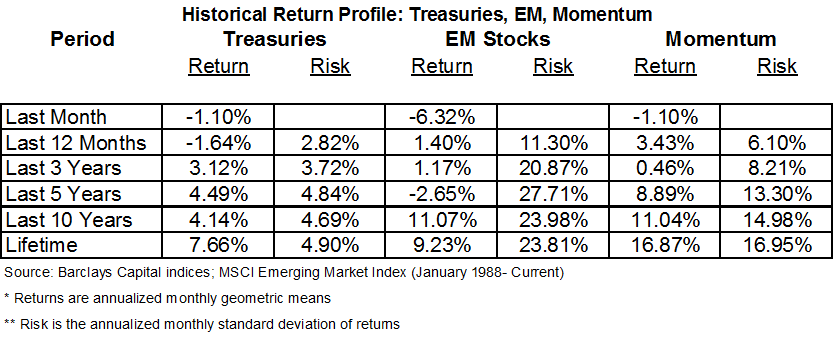
Emerging market stocks have been the most negatively correlated with Treasuries of the aforementioned equity asset classes (r=-0.17). EM stocks' tremendous performance in the mid-2000s, which featured annual returns of at least 22% from 2003-2007, handed off nicely to the Treasury outperformance during the credit crisis. In the last ten years, this switching strategy has beaten the S&P 500 by over 4.1% per annum with similar volatility. Over the totality of the dataset, EM stocks have been a high beta function of the developed world, and this momentum strategy has generated tremendous returns rotating towards the hot market during rallies and towards the safe haven of Treasuries during bear markets.
Of course, the trailing twenty-five years have been historically strong for both emerging market stocks and U.S. Treasuries, which I believe we will look back on in future periods as a historic anomaly. While investors should not expect a 17% annualized return over the next twenty-five years, I believe that this switching strategy will continue to produce alpha. Even in the trailing five years as emerging market stocks produced a negative cumulative return, this momentum strategy managed a 8.9% annualized return, which would have outperformed the S&P 500 on both an absolute and risk-adjusted basis.
Readers wishing to implement this switching strategy in their own portfolio would have owned Treasuries in June 2013, given the underperformance of EM stocks versus Treasuries in May. While the Treasury index again produced a negative monthly return, these bonds still outperformed emerging market stocks for the month, which declined by over six percent and are now down nearly ten percent in the last two months. Emerging market stocks continue to lag domestic stocks given the emerging world's higher weight towards lagging materials and commodities stocks, heightened geopolitical risk on the Korean peninsula and in the Middle East (newly Egypt), and increasingly accommodative monetary policies of developed nations which are weakening their respective currencies and shrinking export-driven emerging markets competitive pricing advantage. The most oft cited emerging market index has now trailed the S&P 500 by nearly 20% over the last twelve months as exporters have been hampered by a weak European economy and concerns over a hard landing in China's depressed values. June's stark underperformance by emerging market stocks would suggest that investors continue to own Treasuries over emerging market stocks in July. Treasury returns were simply less ugly than emerging market stock returns over the last month. The performance gap between Treasuries and EM stocks has shrunk. If the global risk rally is to continue, emerging market stocks, and the commodities so important to some of these economies, must eventually join.
Summary
For Seeking Alpha readers interested in gleaning long-term alpha through momentum, I will be updating the performance of these three trades (Treasuries/S&P 500, Treasuries/Russell 2000, Treasuries/EM Stocks) at the beginning of each month. By providing performance over the trailing one month, momentum investors can follow along with these trades in their own portfolios. Please check out my aforementioned article on fixed income momentum strategies, and look for an update of my equity momentum strategies shortly.
No comments:
Post a Comment