Disclosure: I have no positions in any stocks mentioned, and
no plans to initiate any positions within the next 72 hours.
One seasonal pattern that I have been keeping track of and trading for 10+ years is an annual pattern that has existed in long-term bond prices. I have tracked and traded this pattern using the 30 year Treasury bond futures contract, however it has also been valid for trading the Ishares 20+ year Treasury bond ETF (TLT).
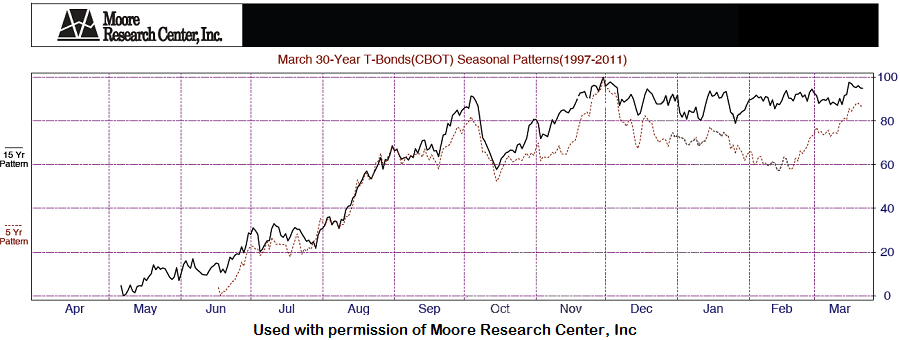
My research indicates that the ideal time to short treasury bond futures (or trade with a short bias) has been mid to late January, and the ideal time to cover the short has been late April to early May. The ideal time to get long is Late April to early May, with an exit near the end of the year. This is not all that different from when I first evaluated this pattern 10 years ago. On average, the long side of this seasonal pattern has been a much more powerful trading opportunity than the short side.
The following is a graphical representation of the seasonal tendency in 30 year bond prices and is used with the permission of Moore Research Center, Inc.
(click to enlarge)
Evaluating this pattern using the iShares 20+ year Treasury bond ETF returns slightly different bullish vs. bearish periods. My analysis indicates that the ideal period to get short or sell has been mid-December to early January, while the ideal period to get long or buy has been from early April to early May.
Seasonal tendencies exist in other markets as well. For example, the June Gasoline futures contract has had an inordinate tendency to rise from mid-January to Late March. Moore Research Center, Inc. research indicates that over the past 15 years, the June Gasoline contract has been up 100% of the time between January 13th and March 27th. If you would like to see the historic results for this pattern as outlined by MRCI, click here.
As most Seeking Alpha readers are primarily interested in stocks, I wanted to see if this pattern has worked on the United States Gasoline Fund, LP (UGA) over its more limited trading history. Over the past four years, the pattern has worked 100% of the time, and the average gain was 4.84 points. (Note: On days where the exact strategy date was not a trading day, I used the next trading day's closing price).
Contango and backwardation relationships are very important to the long term returns of both commodity futures contracts and commodity ETFs. If you are not familiar with these concepts, this article will get you up to speed. Forward curve relationships are an additional factor that can be used in conjunction with seasonal patterns.
While I would never trade a seasonal pattern blindly or as a stand-alone strategy, I think they can make good secondary indicators or predictive factors. In the case of this bond seasonal trade, I always combine the seasonal idea with my price-based trading strategies.
Will this Treasury Bond pattern continue to work in the future?
Treasury bond yields have been declining for around 30 years, which has fueled a massive, secular bull market in bond prices. Is the seasonal pattern mentioned above simply a manifestation of this ultra-long term bull market? This is something to consider, as rates are so low now it hard to believe that this bull market could possibly have much further to go.
I am convinced that over the next 20-30 years, long-term government bonds will be a terrible investment. My viewpoint is that rates will begin a long term uptrend (and bond prices a downtrend) when the Federal Reserve sees that nominal rates can rise while still maintaining negative real yields.
From this perspective, the key to understanding the future of fixed income is that the government needs negative real yields in order to "pay for" its outstanding debts. The "fiscal cliff" and "debt ceiling" debates make it clear that the debt problem is not solvable via the democratic process. As a result, the solution to the debt crisis will be left to the machinations of the Federal Reserve and the Treasury Department.
A shift to a long term secular uptrend in rates (downtrend in bonds) might cause a shift in this market's seasonal tendencies. As a result, the relationships mentioned in this article must be monitored as underlying interest rate conditions change.
Additional disclosure: I have an economic relationship with Moore Research Inc. and use their material with written permission. Note that the Bond seasonal pattern dates identified in this article are drawn from my own research.
No comments:
Post a Comment