Thursday, January 31, 2013

Looking To Profit From The Economic Recovery? Here's How


Disclosure: I am long JPMWFC(More...)
2012 marked a monumental year in regards to housing and the economic recovery. Unemployment declined, the economy began to stabilize, and consumers were more confident about their financial future. As 2013 begins, many investors are still somewhat leery about investing in the housing sector. My aim, through this article, is to provide a compelling reason why housing is poised for a robust recovery for years to come. I will then offer my suggestions as to which stocks are well positioned to take advantage of this recovery.
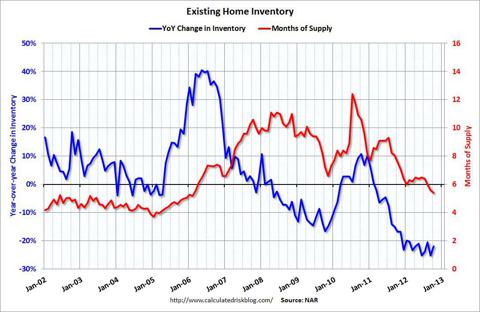
To begin, the major question prevailing in the market is whether home prices will continue to decline? So far in 2013, the answer seems to be "no." Housing inventory has fallen roughly 44% from its peak level in early 2010. As indicated by the chart below, inventory continues its slow and tepid decline. Very methodically, the available housing inventory in America is being purchased.
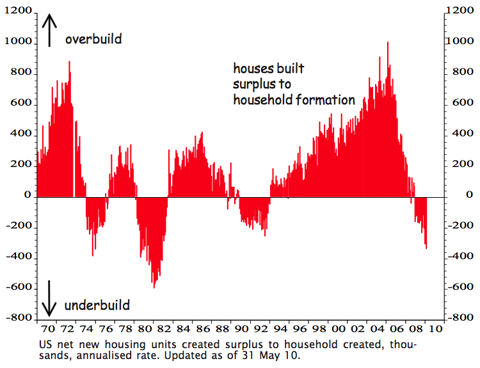
This decline in housing inventory is important for two reasons. First, the oversupply occurring in the early 2000s is being corrected by natural means as consumers continue the deleveraging process. The chart below presents the mass housing optimism prevailing prior to 2008. During its peak, America was producing nearly 800,000 more houses than it needed. This surplus was a direct result of very loose underwriting standards, combined with mass consumer optimism regarding the housing sector overall. As such, individuals who otherwise couldn't afford homes, entered into the market. The subprime market was particularly prominent in the years 2001 to 2007. As such, the housing sector must first correct this oversupply in an effort to create housing demand and subsequent rising prices.
Second, there is now a viable market of both buyers and sellers within the housing sector. These influences will tend to stabilize prices as investors are now more willing to purchase homes for the long term. The following chart shows year-over-year changes in housing inventory. The trend continues to move downward as the available inventory in the market is being bought. The oversupply in the chart above correlates with the heightened inventory levels prevailing in the market. The decline in inventory levels may also indicate that sellers believe the market has reached a bottom. Sellers, believing they can now wait for a more robust recovery, do not list homes that are otherwise for sale. They elect instead to wait for an impending upturn in demand or a subsequent increase in prices.
The opposite is true when sellers believe prices will fall. In this instance, sellers rush to the market to sell their homes at the best available price, to avoid selling at even lower prices. This reaction creates massive increases in inventory, much like what was realized in 2007. As inventory continues to decline however, I would expect demand for housing to rise. This upturn in demand will subsequently create a rise in housing prices overall.
(click to enlarge)
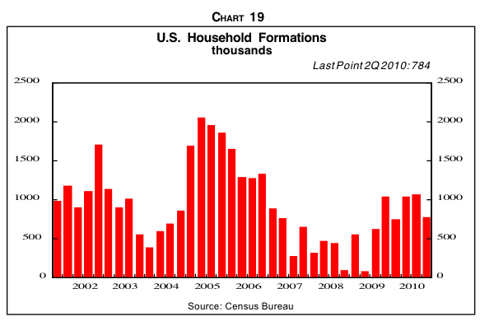
How is this demand for housing going to come about? Well, to answer that question, an investor must know how many households are being formed. The chart below shows household formation from 2002 to 2011. Notice that each year since 2008, household formation increased. This is important as the household formation increase correspond directly with the housing inventory decreases mentioned earlier. As consumers continue to form households, they naturally will demand housing. This trend has been occurring slowly since 2009.
(click to enlarge)
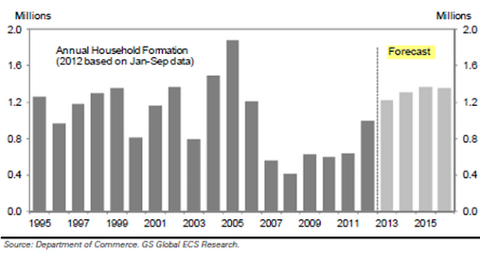
Household formation, is being postponed due primarily to various economic circumstances prevailing today. The tepid jobs market, combined with economic uncertainty has made consumers hesitant to form households. However, as the jobs market and economy continue to improve, so too will the prospects for household formation. Below is a chart from the Department of Commerce, indicating the forecast growth of households. Notice that the forecast indicates continued growth in household formation. This continued growth in household formation is occurring simultaneously with the decrease in available inventory. Over time, I believe the continued growth in household formation will overtake the available inventory within the market.
(click to enlarge)
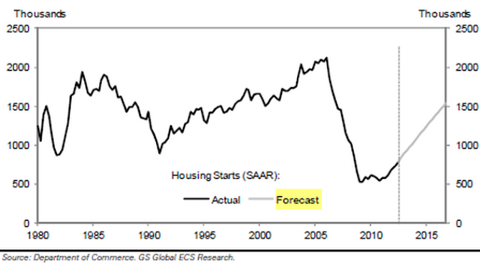
Once household formation and available inventory reach an equilibrium point, the oversupply of housing will be completely eroded. When this occurs, consumers will demand more housing as they continue to form households. This demand, I believe, will ultimately drive new home construction for years to come. My theory has already been proven correct as household starts are continuing to rise. Below is chart indicating current and forecast household starts. Notice the continued uptrend since 2008.
(click to enlarge)
Given this information, there are two sectors that I believe show considerable promise to rise in value for the long term. These sectors are housing and financials. In regards to housing, as I have already indicated, available inventory is shrinking each month. Likewise, unemployment is continuing its steady, albeit slow decline. Investors, and society in general are becoming more confident regarding their fiscal matters. Consumers, particularly those hardest hit by the financial crisis are getting their personal balance sheets in order. These consumers are paying down debt and increasing their savings. These circumstances translate directly into the housing and financial sectors. I recently read an FDIC report, which shows rapid deposit growth in many of the large financial institutions such as Wells Fargo (WFC) and JP Morgan (JPM). These deposits, due primarily to low interest rates, will at some point be deployed in higher yielding assets. Due to the very low mortgage rates currently prevailing, I believe a substantial portion of these assets will be deployed in housing related aspects. As such I believe ETFs such as KBE,ITB, and XHB show considerable promise. ETFs such as XLFIFGL andVNQI, also show promise to increase in value.
In addition, household formation is continuing to grow, again, at a very slow rate. In many markets it is now cheaper to own a home than it is to rent one. Home prices in many of the areas hardest hit by the recession are beginning to rise. Areas such as Nevada, Miami, Arizona, and Phoenix, are showing considerable signs of improvement. The lower available inventory combined with the increased affordability and household formation will allow the housing market to reach equilibrium. After this equilibrium has been reached, consumers will demand houses, further exacerbating construction overall. All of these factors, I believe, create a very compelling argument for the long-term rise in many of the housing and financial assets mentioned above.

Wednesday, January 30, 2013

Government bond futures ready for launch in H1


Government bond futures ready for launch in H1

866 0
 0  4  0 Google +10
China is ready to launch government bond futures in the "first half of the year" as it expands the scope of financial derivatives allowed to trade on the domestic market.
The China Financial Futures Exchange has made all necessary preparations and trading in the bond futures can start within one or two months after the bourse gets regulatory approval from the State Council, said Zhang Shenfeng, general manager of the exchange.
"The bond futures are 'very likely' to be unveiled in the first half of this year," he told STV News in an interview yesterday on the sidelines of the Shanghai People's Congress meeting.
He said the bond futures on the most-traded five-year bonds would be the first to be launched.
Government bond futures offer a hedging tool for interest rate risk and are part of the ongoing attempts to liberalize interest rates.
The financial futures exchange is one of China's four futures bourses.

Sunday, January 27, 2013

股指跨期套利四种方式


  • 股指跨期套利四种方式
  •    发布时间:2012-01-30 14:13           来源:东证期货                  
    股指期货上市四个月,根据我们持续跟踪的期现套利模型,发现随着时间推移,期现套利机会和收益率均有明显下降。事实的确如此,随着期指市场套利参与者增多,市场效率提升,传统期现套利机会逐步缩减,利润越来越薄。相反,倒是我们前期不怎么关注的跨期套利,表现相对稳定,存在一些不错的套利机会。下面我们探究几种比较可行的跨期套利机会。
    一、程序化跨期套利机会
    如果跨月价差波动表现相对稳定,而且持续在一定区间范围内波动,这个时候存在很好的程序化跨期套利机会,比如在7月16日至7月27日期间,IF1009和IF1008两者价差基本在12与16点之间波动,安全起见,我们可以上下均让掉0.5个点,也即当价差回落至12.5点的时候,我们可以进行反向套利操作,买进IF1009卖出IF1008,当两者价差扩大至15.5点时,将套利头寸平掉,粗略估算交易手续费为1个点,那么我们可以赚钱2个点的利润。同时,反手进行正向套利操作,买进IF1008卖出IF1009,等待价差回落至12.5点。再比如,7月29日至8月5日,两者价差表现也较稳定,也存在这种套利机会。如此反复循环,虽然每次利润较少,但机会出现频繁。因此,总的看来,收益还是不错的,不过这种套利机会只适合程序化交易。
    图1:IF1009与IF1008价差稳定波动区间

    二、事件性跨期套利机会
    在红利发放期间,合约间的价差都容易发生较大幅度变化,而恰恰跨期套利对于由分红引起的价差变动比较敏感,特别对于持有成本模型而言,分红率影响着无套利区间的上下限。我们沪深300成份股每年的红利集中发放的5、6和7月份,这一时期价差变化幅度也较大,是实施跨期套利的良好机会。根据经验规律,随着分红高峰的到来,远月与近月合约价差重心会走高,反之,价差会走低。因此,我们可以在红利发放前期考虑进行反向跨期套利,因为随着价差的扩大,反向跨期套利将获利;反之,在红利发放结束前期可考虑正向跨期套利。比如,7月8日IF1012与IF1008价差为67点,这个时候成分股分红的高峰期刚过,我们可以考虑进行买IF1008卖IF1012的正向套利操作,7月19日,价差缩小至40点,8个交易日可以赚取27点价差。
    图2 IF1012与IF1008价差走势(0708-0723)

    三、新合约上市首日所潜在的跨期套利机会
    回顾期指上市四个月,每次新合约上市都会受到一定程度的追捧,从合约走势上看,大多呈现平开或者高开高走的态势。新合约容易走高,一方面是市场有炒新的惯性思维,新合约容易吸引人气,这样就容易出现价量齐升的局面;另一方面是新合约的定价上有一定时间价值低估倾向,那么其会低于实际价值,随后就会被市场所纠正,合约会顺势走高。正是基于这样的原因,新合约和当月合约价差扩大的概率较大,因此,新合约上市首日存在较好的跨期套利机会,即在买入新合约的同时卖出当月合约,等价差扩大到一定程度后,双向平仓获利。比如,IF1103 合约上市首日,IF1103与IF1008价差开盘时最低,随后价差快速扩大,盈利空间在10 个点以上。另外,IF1007和IF1008作为新合约上市的首日,也同样存在这种跨期套利机会。
    图3:IF1103与IF1008合约7月19日价差走势

    四、老合约在退市之前几个交易日潜在的跨期套利机会
    这里我们以IF1009合约与IF1008合约作为研究对象,从8月12日开始,主力逐步开始移仓,IF1009持仓稳步增加,交易量从8月16日开始快速放大,资金移仓明显,受到资金推动效应影响,IF1009合约出现价量齐升局面;反观IF1008合约,由于资金逐步撤出,IF1008对于投资者的吸引力大大降低,资金关注度的弱化也拖累了其走势,两者相比IF1009走势明显强于IF1008走势。从两者价差上看,8月12日两者价差最低不足7点,不过之后随着主力移仓效应的逐渐放大,两者价差持续拉大,8月19日也即IF1008合约交割前一交易日,价差达到最大值超过22点。因此,基于主力移仓效应到来的跨期套利机会不容忽视。投资者可以考虑这样一种策略:也即临近交割日前七个交易日的时候就可以考虑卖出当月合约同时买进次月合约的跨期套利操作,临近交割日的前一交割日选择获利了结,该策略风险相对较低,而收益较为稳定。


    Saturday, January 26, 2013

    高科技行业裁员潮波及中国:年终奖“萧条”


    高科技行业裁员潮波及中国:年终奖“萧条”
    http://www.creaders.net  2013-01-26 15:26:12  21世纪  [0条评论,查看/发表评论]
      最近,在国际“四大”会计师事务所担任高级经理的赵艳显得闷闷不乐。临近年末,各个公司都准备发放年终奖,按照惯例,赵艳依然会多拿1个月的工资作为奖金。但公司同时提出,2013年6月底前,每个员工都必须休12天的无薪年假。这不禁让她想起2008年金融危机时“凄风苦雨”的时刻。
    “我们现在基本都不用加班,比往年这个时候空闲了不少,”赵艳称,“部门里的人员倒显得有些冗余了。”
      过去的两个季度里,赵艳所在的“四大”并没有达到预期的业绩,因此,“公司预测未来的经济状况都不太乐观”。在此基础上,公司对于审计项目的报价开始下跌。尽管管理层并未向员工提及裁员,“但领导在内部称,不排除增长无薪假的可能。”
      在赵艳看来,今年的加薪希望十分渺茫,而她的遭遇,或多或少反映了“四大”当下的困境。此前,德勤的hr部门亦向记者表示,“2012年中国地区的四大及整个会计师行业都表现明显的下行态势”。在严峻的经济形势下,“德勤对新一年里的整体人才和薪资计划持谨慎和持续观望态度,随时需要根据市场变动进行调整”。
      事实上,不仅是四大,几乎所有公司都面临着外需放缓与经济增速回落的双重压力。对不少员工来说,不仅加薪显得遥遥无期,就连年终奖励都在遭遇自己的冬天。根据美世咨询的调研,有28%的公司实际发放的年终奖会较2012年初的预算有所下调,55%的公司会选择维持年初的预算,只有17%的公司会上调年终奖金。而科锐国际的调查显示,相较于2011年的实际发放额,近四成的受访企业表示将下调年终奖。
      与之相对的是,hr们的压力比以往任何时候都大——毕竟,在各种预算缩减的情况下,保留和激励核心员工变得更有挑战性。眼下,hr们面临的共性问题是,人力资源制度该如何变得更有弹性,来适应不断变化的环境?如何为将来的经济复苏做好人才储备?可以肯定的是,管理者们需要思考的,绝不仅仅是薪酬。
      作为基金经理的吴凯,最近脸上总算有了一丝笑容。2012年底的资本市场给一年的行情带来了一些惊喜,但仍无法挽回基金公司整年的惨淡。对吴凯来说,他的日常工资仅占到整体薪酬的25%,剩下的75%都是年终奖及超额奖金。而2012年的业绩意味着,吴凯很可能只拿到2011年时一半的年终奖,甚至有可能“分文不取”。
      不仅是国内的基金行业,纵观全球,金融业都笼罩在一片阴云中。今年1月10日,综合金融服务巨头美国运通公司宣布将裁员5400人,以削减成本,并借此进行业务调整。而去年前9个月,高盛裁撤了700个工作岗位,去年下半年,瑞银也宣布了一项规模达1万人的裁员行动,并宣布退出债券交易领域。2012年底,花旗集团同样进行了规模超万人的裁员。这股裁员风还刮到了已有近80年历史的摩根士丹利身上。该公司计划从今年1月起裁减1600名员工,涵盖销售、交易和投资银行等部门。
      相比之下,在国内的四大国有银行工作的刘青就显得轻松了许多。尽管过去一年内,他所在的银行网点的经营业绩并不理想,业绩增幅相比前一年下降了不少,但刘青至少不用担心被裁掉。“银行的年终奖与个人绩效关系不大,更多地会看区域及网点的整体业绩。”刘青称,“即便个人业绩不佳,公司最多也就让你换一个岗位,不会进行裁员。”但他同时表示,今年加薪的希望并不大,甚至有可能减薪。
      与金融业同样萧条的还有高科技行业。过去一年内,大量的it及消费电子公司宣布了大规模的裁员计划。2012年5月,松下对外宣布了裁员计划,将其全球员工数量缩减至33万人,裁员10%,数量达3.6万人之多。几乎在同时,惠普宣布将削减3万个工作岗位,整个裁员计划将在2014年完成,届时惠普将削减8%的员工数量。紧接着,诺基亚宣布在2013年年底前节约16亿欧元的生产成本,同时在2013年底前裁员约1万人,重组费用约为10亿欧元。除此之外,索尼、夏普、摩托罗拉等公司也纷纷计划缩减员工规模。
      在这波高科技行业的裁员潮中,有些已波及中国。因此,只有收到老板“不会裁员”的邮件时,这些企业的员工们才可以过个安心年。至于年终奖,显然已是奢望。
      当然,高科技行业也有例外。在线旅游网站“去哪儿”网新闻发言人钱臻表示,公司的薪酬制度以“15薪”为基数,即年终奖基数为3个月的工资,超出部分以员工绩效而定。
      2012年,去哪儿内部划分为“机票”、“酒店”和“无线”三大bu(事业部),并推出了内部创业体系,每个bu内的创业团队都有单独的期权池。在此基础上,去哪儿网的员工数在2012年由900多人增加至1300人左右,今年仍可能新增300名左右的产品经理与工程师。
      金融与高科技行业的薪资或许无法让人们展颜一笑,但对消费品行业来说,情况可能会乐观许多。在欧莱雅中国区人力资源总监高明(christophe gamet)看来,人们并不会因为经济的波动而减少对化妆品及日用护肤品的购买,这是消费品行业薪资待遇超乎许多人想象的一大原因。
      目前,欧莱雅在中国有近3000名员工,运营着21个化妆品品牌。2011年,欧莱雅在华销售收入为107亿元,比上一年增长18%。2012年,欧莱雅在华的化妆品销售增速较往年有所放缓,但在全球经济严重衰退的当下,中国市场的巨大潜力仍被欧莱雅及其他日化巨头视为增长的“强心针”。
      “截止到2011年,欧莱雅在中国市场上已经实现了连续11年的两位数增长,2013年,我们的增长目标依然是两位数的。”高明说道,出于对中国市场的乐观,欧莱雅并没有减缓业务扩张与招聘的节奏,反而加快了向三四线城市拓展和搜寻人才的力度。
      就在两周前,欧莱雅中国新增了一个“人才总监”的职位,设立该职位就是为了在更大范围内搜索核心人才,并想方设法地为公司内部的关键岗位留住人才。一个月前,欧莱雅中国培训中心在上海正式成立,这个占地3300平方米、可同时容纳600人的培训中心被视为欧莱雅在华人才培养及发展方面的重要举措。
      “仅以美发为例,2013年欧莱雅中国培训中心预计会举办1400次以上的美发培训,为17000多名发型师提供专业培训。”高明表示。毕竟,中国市场的兴衰,事关欧莱雅在“未来10年在全球赢得10亿新消费者”的目标能否顺利实现。
      即便如此,除去一些逆势扩张的行业或企业,大多数公司仍明显感到了阵阵寒意。根据美世咨询在2012年11月进行的调研,63%的公司表示能够完成2012年的预设业务指标,而在2011年同期参与调研的公司中,79%的企业表示能够完成2011年的营业收入指标。
      在此基础上,2013年的薪酬前景也并不乐观。美世的数据显示,2013年总体预计薪酬增长率(不含员工晋升)为8.8%,而上一年,这一数字为9.4%。以行业来看,2013年医药及医疗器械行业的预估薪资增长率最大,平均值为9.6%;而工业制造行业的预估值最为保守,平均为8.4%。
      薪酬的不尽如人意,让不少人动起跳槽的念头,赵艳也不例外。往年的这个时候,往往是人才市场最为活跃的阶段,但眼下,赵艳感到猎头们的电话明显减少了。
      对此,美世咨询中国区信息咨询业务咨询总监曹燕萍表示,“许多企业在2013年并无扩张计划,市场放出的空余职位变得十分有限。”
      根据美世的调研,2012年第三季度,整体市场的实际员工编制增长率为3.7%,这一数字在2012年第四季度下降到2.5%。55%的公司表示,将在2013年增加员工编制,但这一比例与2012年相比已有大幅下降。与之相对的是,73%的公司将在2013年维持现有的企业规模,只有近20%的公司计划在中国扩张或开设新的分支机构。
      赵艳记得,在经济繁荣的时候,她的同事跳槽时动辄加薪50%,但现在,“别说是跳槽加薪,只要不被裁员就已经谢天谢地了。”赵艳自我调侃道。
      美世此前的调研显示,一般员工考虑跳槽时,加薪30%以上才会选择去新公司,“但现在,跳槽的风险显然比过去大了许多。”曹燕萍指出。在她看来,在市场上挖人的公司的前景可能也不太稳定,一旦公司未来发生裁员,跳槽去的员工作为新人,经验较短或尚处于试用期,就有可能成为被裁的一员。
      “坏消息下,一个好的现象是员工们的心态不再像前几年那么浮躁,反而更加踏实。在考虑跳槽时,他们也会更加综合地思考各个因素。”
      当然,hr们的日子也不好过。韬睿惠悦去年的调研显示,56%的公司称会增加成本管控的举措。其中,冻结招聘、采用低成本招聘渠道以及节省培训预算是被最多采纳的做法。
      譬如,hr们会评估,哪些可有可无的培训应该被取消,哪些与核心业务相关的培训一定要保留;哪些培训可以不用外部专家来上课,而改用内部人员。此外,一定级别以下的招聘是否可以不用猎头,而改用招聘网站或人脉介绍,以此节约成本。在人员激励方面,过去采用现金激励的方式是否可以做些改变,即减少现金支出,改用“及时认可”等方式。
      开源节流的基础上,如何在有限的资源下产生最大的效果,激励和留住核心员工,是hr们面临的共性问题。在经济下滑的时候,公司需要这部分核心员工一起渡过难关,而当经济转好后,他们也是推动公司增长的最主要动力。
      “一个明显趋势是,越来越多的公司开始在浮动薪酬上动脑筋,希望用这部分薪酬激励高绩效员工完成目标。”韬睿惠悦全球数据服务咨询中国区总经理许文宗指出,在此基础上,薪酬资源会越来越向核心及高绩效员工倾斜。
      “过去,很多老板并不愿把最差的员工找出来,造成的结果是大家的福利都差不多。未来,员工间的薪酬差异会更加明显,毕竟,在薪酬福利总量下调的情况下,公司需要更好地激励高绩效及高潜力的员工。”许文宗称。

    股指期货套利

    股指期货套利


    股指期货套利是什么?


    股指期货套利就是通过锁定股指现货价以及股指期货价之间的差价来获得无风险利润。

    股指期货套利 - 介绍


    股指期货的三大作用之一就是所谓的套利。在中国股指期货出台之前,业内已经对股指期货的套利法做了大量的研究。这是因为股指期货为机构投资者开启了一道期待已久的大规模无风险获利的门。是的,在股指期货出台之前,股票基金以及以股票为主的机构投资者并没有任何无风险投资的门路。股指期货出台后,很多私募基金都成功地在很短的几天内时间内套利2% 到5%不等。这种回报率不但无风险,而且将其年收益化的话确实是高得惊人。

    这里讨论的套利指的是无风险套利,Arbitrage,而不是一般专家和网页上提起的跨期套利,Spreading。在投资界里,跨期投资并没有无风险套利功能,所以不应该以“套利”为名。

    那么股指期货套利到底是什么呢?它为什么能制造无风险利润呢?股指期货有几种套利法呢?我们将在这里给大家做详细的探讨。


    套利到底是什么?


    套利(Arbitrage)是一种通过锁定两种 金融工具之间的价差来获取无风险利润的投资法,也叫无风险套利(Risk-Free Arbitrage)。简单地说就是在瞬间赚差价。基本上,无风险套利就是一种不管股价怎么变化都能在没有风险情况下赚钱的方法,好比天上掉馅饼。在一个多种衍生产品的市场里头,一只股票或者指数都会有很多比如期货以及期权的衍生产品在同时为其造价。每当现货价以及衍生产品价格出现偏差时,这个偏差就能以套利技术被锁定,当偏差消失后,就能赚取利润。这种偏差的消失可以再几天或者甚至几分钟内完成,使得套利变得又快又安全。

    简化套利例子

    假设一粒苹果卖五毛钱,在同时,你有一个朋友没空去菜市场,愿意托你以每粒六毛钱的价格购买。

    这时你可以立即以五毛钱买入,再无风险地以六毛钱卖出,赚取你原先跟这位朋友说好锁定的一毛钱价差。这就是无风险套利。


    中国股指期货套利


    在中国股指期货市场里头,套利就是套沪深300点位以及股指期货合约结算价之间的价差。

    简化股指期货套利例子

    假设沪深300在2500点。其近月份股指期货合约结算价是2580点。你希望通过指数以及股指期货价格的差价进行套利。

    沪深300与其近月份股指期货合约之间有一个80点的差价(称为基差,Basis)。

    投资者便可以买入沪深300现货然后同时卖出股指期货来锁定那80点价差进行套利。这就像你当下买入五毛钱苹果然后同时协议把它用六毛钱卖给一个买家,道理是一样的。

    上述只是一个比较简单的中国股指期货套利的概念。其中有一些技术上的问题要解决,其中最重要的是,沪深300是个指数,如何能够买入现货呢?


    中国股指期货套利中以什么做为现货?


    想要进行沪深300股指期货套利就得先解决何为现货的问题。沪深300指数是以沪深两市三百只股票价格为基础的指数。因此,沪深300指数的现货便是沪深300指数里的所有股票。这里也是股指期货套利的最大问题所在。如果要为了套利买入或者 估出沪深300,你不止要买卖沪深300里头所有的股票,而且还要依照沪深300的权重计算方式来按比例买卖才能取到买卖沪深300指数的效果。这种买卖不止需要庞大的资金也需要专业的计算。在这两方面就已经把一般散户置之门外。也有一些机构选择性地买卖沪深300里头最权重的几十只股票作为沪深300的现货。这样的做法在指数跟踪上面会有偏差。这种偏差如果在套利空间很大的情况下并不是太大的问题但是随着股指期货市场的成熟,套利空间也会变得很有限,如果跟踪不好,可能连套利空间都会没有。股指期货套利所需要的庞大资金也是一种让企图操纵市场的人一个大难题,使得股指期货市场对于股市更加安全。

    也有一些专家建议能用沪深300指数型基金作为股指期货套利中的现货。使用这个方法存在基点问题。第一,现有的沪深300指数型基金都存在追踪偏差。就是说它的价格不一定百分百跟着沪深300指数浮动,在套利空间比较小的时候,这种偏差可能使得套利空间缩小或者变得不存在。第二,现有的沪深300指数型基金都无法 融券卖空,大大减少套利方法的可能性。第三,现有的沪深300指数型基金的流动性都不如直接买卖股票好。流动性差会直接导致买卖价格无法最优化,使得套利空间缩小或者变得不存在。 


    股指期货套利基本原则


    套利的基本原则就是通过买低卖高来套住期货价以及现货价的价差。这个价差称之为“基差”,也就是期货价以及基础资产价之间的差据。当然,股指期货价之所以会跟指数价有价差的主要原因是因为市场利率的因素。只有当价差大于将市场利率考虑在内后的价格的时候才是有套利空间的。如果价差并不大于市场利率的话,把资金直接投在债券将能得到更高的无风险回报。也可以说,只要股指期货价格与其理论价格出现明显偏差,就有套利空间。


    中国股指期货的主要套利法


    股指期货有两种基本的套利法。一种叫做“买基差”(Long the Basis),用来在股指期货价比指数价高的时候套它们之间的价差。另一种基本套利法叫做“卖基差”(Short the Basis),用于股指期货价比指数价低的时候。这些套利法都归类为“指数套利法”(Index Arbitrage)。这些套利法都是利用股指期货合约到期时一定是与沪深300现货价一致的原则来套其中的基差。

    买基差(Long the Basis) 股指期货套利法
    当股指期货价格明显比沪深300点位高,就可以通过同时买入沪深300现货,估出股指期货来套利。接着学习买基差套利法。

    卖基差(Short the Basis) 股指期货套利法 

    Thursday, January 17, 2013

    3 Reasons Why The Energy “Experts” Are Wrong (XLE, UCO, USO, CVX, COP, SCO)

    3 Reasons Why The Energy “Experts” Are Wrong (XLE, UCO, USO, CVX, COP, SCO)

    January 17th, 2013


     0
    share0
    oil-refineryKent Moors: Last week, another batch of oversimplifications attempted to explain a significant decline in energy stocks.
    Excuses ranged from declining demand to shale oil and gas gluts. Others pointed toward a general market Armageddon.
    But you and I know better than to believe this hype.

    The Euro’s Demise Has Been Set in Motion: Are you protected?


    "Nationalism will emerge. Healthier countries will not see fit to spend their hard earned money to bail out their less responsible neighbors."

    CLICK HERE to get your Free E-Book, “Why It’s Curtains for the Euro”

    Last week the S&P closed at a five-year high, NYMEX West Texas Intermediate (WTI) crude oil futures closed higher than in any session since September 18, while the spread between WTI and London’s Brent benchmark rate is the narrowest it has been since September 14.
    We recognize that the harbingers of doom are right only if markets and economies completely collapse. Once again, we know that is not going to happen.
    None of this means we are simply off to the races. But they do indicate how the half-baked approaches used by some “experts” are not reflecting reality.
    Their arguments are wrong for three very basic reasons. And once you learn them, you stand to profit from the biggest energy trend in decades.
    Why You Need to Avoid the Hype in Energy
    First, these pundits conclude something will automatically occur simply because it’s possible.
    For example, the argument rests on the observation that because a new field could be discovered, it will automatically be developed or that problems experienced currently with fracking in unconventional production could be solved by later technical breakthroughs.
    “Because something is possible” does not mean it’s guaranteed.
    Even if a breakthrough occurs, new extraction methods are introduced when the market requires them. Nobody just floods a market with product. There would be serious consequences. Most of the production levels expected from shale fields are determined by companies balancingcapacity with demand. This is not a race to bankruptcy.
    Which leads me to the second mistake.
    Producers, processors, and distributors of both oil and gas-based products do not simply pump, refine, and transport so that they can depress end-using markets with excess product. The entire upstream-midstream-downstream process has its own internal balancing. Once again, this is not a function simply of what is in the ground and extractable.
    It is determined by what the overall process needs.
    Occasionally the calculation is wrong, or some outside situation (geopolitical event, natural disaster, overly warm or cold winter, and the like) throws a wrench into the estimations. A short-term spike or dive takes place as a result. That is not, however, the harbinger of some “brave new world” coming.
    Third, there is the most fundamental reason of them all. In normal markets, the aggregate usage of energy will rise. This is especially true when you consider that two-thirds of the world’s population is poised for rapid economic expansion.
    Despite what some want you to believe, demand is not a function of Western Europe and North American needs. It hasn’t been for some time.
    Demand has been suppressed because of the economic stagnation on both sides of the Atlantic. But that has been coming to an end. And the increase in overall global demand continues to demonstrate an upward pressure.
    I hasten again to note that this is not going to result in an overheated short-term market but is likely to result in a rising price level nonetheless. However, here is an emerging new factor in all of this.
    As you might have guessed, this is a balance issue. It is, in fact, the most important element moving forward. Energy prices-and share values of companies involved in the sector-are going to be influenced by a new dynamic.
    This involves an expanding range of energy sources that will be integrated into a developing system of production, processing, and delivery.
    This may be the most significant change to hit energy investment in decades. And there are going to be some massive profit opportunities developing.
    But to maximize our profits, we need to be ahead of the curve, and begin investing in certain places before others have the insight to do so. Companies I’m about to start mentioning in my advisory services Energy Advantage, Energy Inner CircleEnergy Sigma Trader, and Micro Energy Trader will benefit from all of this.
    So let others bang the drum of old hypes and tired fears. We are simply going to ride the new wave and make some serious money.
    I’ll be laying out some of the strategies to help us get ahead in the coming weeks.
    Related: SPDR Select Sector Fund (NYSEARCA:XLE), ProShares Ultra DJ-UBS Crude Oil (NYSEARCA:UCO), United States Oil Fund LP (NYSEARCA:USO), Chevron Corp. (NYSE:CVX), ConocoPhillips (NYSE:COP), ProShares UltraShort DJ-UBS Crude Oil (NYSEARCA:SCO).
    Kent MoorsWritten By Kent Moors, Ph.D. From Money Morning
    Dr. Kent F. Moors is an internationally recognized expert in global risk management, oil/natural gas policy and finance, cross-border capital flows, emerging market economic and fiscal development, political, financial and market risk assessment. He is the executive managing partner of Risk Management Associates International LLP (RMAI), a full-service, global-management-consulting and executive training firm. Moors has been an advisor to the highest levels of the U.S., Russian, Kazakh, Bahamian, Iraqi and Kurdish governments, to the governors of several U.S. states, and to the premiers of two Canadian provinces. He’s served as a consultant to private companies,financial institutions and law firms in 25 countries and has appeared more than 1,400 times as a featured radio-and-television commentator in North America, Europe and Russia, appearing on ABC, BBC, Bloomberg TV, CBS, CNN, NBC, Russian RTV and regularly on Fox Business Network.
    Moors is a contributing editor to the two current leading post-Soviet oil and natural gas publications (Russian Petroleum Investorand Caspian Investor), monthly digests in Middle Eastern and Eurasian market developments, as well as six previous analytical series targeting post-Soviet and emerging markets. He also directs WorldTrade Executive’s Russian and Caspian Basin Special Projects Division. The effort brings together specialists from North America, Europe, the former Soviet Union and Central Asia in an integrated electronic network allowing rapid response to global energy and financial developments.

    Monday, January 7, 2013

    How Much Will Your Taxes Jump?

     By LAURA SAUNDERS
    In the nick of time, and amid much political drama, Congress passed the American Taxpayer Relief Act on New Year's Day—averting massive tax increases for nearly all earners that were slated to take effect Jan. 1.
    Even so, millions of people soon will feel something less than relief from the new law.
    Tim Foley
    The bill approved in Congress to avert the fiscal cliff would bring the first major tax increase on high earners in 20 years. Laura Saunders breaks down how new tax increases will impact across different tax brackets. Photo: AP.
    While the top 1% of taxpayers will bear the biggest burden, many other families, affluent and poor, will pay more as well.
    The most immediate change affects nearly all workers: Congress allowed a two-percentage-point cut for the employee portion of the Social Security tax to expire. As a result, each will owe up to $2,425 more in payroll tax this year than in 2012.
    Beyond that, the new law's effects will be highly individualized—and in some cases highly painful.
    "Many affluent people in exactly the same financial position as last year will see a substantial tax increase," says David Kautter, a director of the Kogod Tax Center at American University.
    Back-Door Tax Increases
    At first glance the law appears simple. In terms of income tax, for example, only the highest tax rate in 2012—the 35% bracket—will increase in 2013, to 39.6%. And that applies only to individuals with at least $400,000 of taxable income or couples with at least $450,000.
    But there are two backdoor tax increases that will apply to people earning far less—$250,000 for singles and $300,000 for couples.
    The first concerns the personal exemption, or the amount of money a taxpayer can deduct for him or herself and dependents. In 2013, this exemption is expected to be $3,900, so a couple with three children could deduct $19,500.
    In 2013 the exemption phases out for people starting at the $250,000/$300,000 income thresholds, and vanishes completely for couples at $422,500 of "adjusted gross income," or income before itemized deductions, and at $372,500 for singles. So, a couple with three children and adjusted gross income of $300,000 or more will lose some or all of their $19,500 exemption.
    Associated Press
    House Speaker John Boehner (R., Ohio), left, and House Ways andMeans Chairman Dave Camp (R., Mich.) confer Jan. 1 as the House weighed the tax bill.
    The other new provision is called Pease, named after former Rep. Donald Pease (D., Ohio). It is a complex limitation on all itemized deductions—including charitable donations and mortgage interest—that will eliminate up to 80% of deductions for taxpayers above the $250,000/$300,000 income thresholds. Experts say this phaseout effectively adds about one percentage point to the top tax rate, including the top rate on capital gains.
    The overall result is that, for many families, 2013 tax rates won't be as advertised. While a retired couple with $180,000 of income and $25,000 of deductions could see no change in their federal tax next year, a single parent of two children earning $260,000 with $30,000 of deductions could see a $3,300 increase.
    Unanswered Questions
    Adding to the frustration, many issues remain unanswered. The Internal Revenue Service hasn't released the new inflation-adjusted tax brackets for 2013, making it difficult for taxpayers to plan, though an IRS spokesman says the agency hopes to publish them soon.

    How the Tax Law Might Affect You

    See some scenarios for how different groups of people may be affected by the tax changes that will take place under the new law passed to avert the so-called fiscal cliff.
    And the Pease limit's effect will vary depending on individual circumstances. For example, people who live in high-tax states may find their charitable deductions are just as valuable as last year, if not more so, says Robert Gordon, president of Twenty-First Securities in New York. But people in low- or no-tax states such as Washington or Nevada could find their charitable deductions cost considerably more, Mr. Gordon says.
    In essence, the new law "replaces uncertainty with confusion," says David Lifson, an accountant at Crowe Horwath in New York. "Only tax wizards can understand the entirety, especially for people earning between $200,000 and $450,000."
    To help you get a grasp of your own 2013 taxes, the Tax Policy Center, a nonpartisan group in Washington, has devised a calculator, available on its website at http://calculator.taxpolicycenter.org/, that can help you crunch the numbers.
    To be sure, one thorny issue did become clearer and more predictable as a result of the new law: estate taxes. Lawmakers retained the $5 million individual exemption for gift and estate taxes and kept it indexed for inflation, while raising the tax rate to 40% from 35%—about the best outcome many could have hoped for. And these changes are permanent, so advisers and families won't have to think for a moment about a relative dying in one year versus another.
    While there still is plenty to digest, here is an early assessment of how the most important provisions could affect you:
    Individual income-tax rates. For most people these rates remain the same as last year, but for the wealthiest there is a new permanent top rate of 39.6%, compared with 35% for 2012. The threshold for the top rate is $450,000 of taxable income for married couples filing jointly and $400,000 for single filers.
    Oddly, the 35% rate seems to remain in effect for people with taxable income between about $398,000 and the new top-rate thresholds. So, for singles, the 35% bracket would span only from about $398,000 to $400,000, and to $450,000 for couples.
    Investment income. The new law doesn't tax dividends at the same rate as wages and other ordinary income, a change that was set to occur this year before the deal was struck.
    Instead, the new law leaves dividends in the same category as capital gains on investments held longer than a year, known as long-term gains.
    But the law permanently raises rates on long-term gains and dividends for top-bracket taxpayers. People who have enough income to pay tax at 39.6% will owe 20% on their net long-term gains, as opposed to 15% in 2012.
    Meanwhile, the 15% rate will continue to apply to taxpayers in the 25%, 28%, 33% and 35% income-tax brackets, and people in the 10% and 15% brackets will continue to have a zero rate on capital gains and dividends.
    Another new tax on investment income, passed in 2010 as part of the Affordable Care Act, takes effect as well. The new 3.8% levy applies to net investment income above a threshold of $250,000 for couples ($200,000, singles).
    Alternative minimum tax. Lawmakers adjusted the 2012 threshold for this complex tax and permanently indexed for inflation three of the variables that determine it.
    The AMT was originally passed in 1969 to apply to wealthy people using many tax strategies. Over time its reach has spread, especially to residents of high-tax states, and Congress has passed many temporary "patches" over the years to reduce the pain.
    If this fix hadn't been made, the AMT would have applied to 34 million taxpayers in 2012 instead of about 4 million. That could have severely disrupted the coming filing season because the IRS would have had to reprogram its computers at the last minute.
    IRA charitable donations. This highly popular provision has been extended retroactively, running from the beginning of 2012 to the end of 2013. It allows taxpayers age 70½ and older to donate up to $100,000 of individual-retirement-account assets directly to a charity and count the contribution as part of the person's required withdrawals from the account, which kick in after 70½.
    While the taxpayer can't take a deduction for the gift, neither does the gift count as income to him or her. So this donation can help reduce adjusted gross income and thus minimize Medicare premiums or taxes on Social Security benefits.
    IRA owners were supposed to take required payouts for 2012 by Dec. 31, and the new law wasn't signed until Jan. 2. But taxpayers who took IRA withdrawals in December can give up to $100,000 of that payout to one or more qualified charities and take the charitable IRA donation. In addition, taxpayers can make 2012 IRA donations through Jan. 31. Details should be coming soon in IRS guidance, according to an agency spokesman.
    Other "extenders." This term refers to a host of temporary provisions, some of which expired at the beginning of 2012 and some at the end.
    Several popular expired provisions were made retroactive to the beginning of 2012 and now will be in effect to the end of 2013. They include the deduction for state sales tax in lieu of state and local income taxes; the $250 deduction for teachers' classroom expenses; and a benefit for employer assistance with mass-transit and vanpool costs.
    The law also extended for five years the American Opportunity Tax Credit; for many taxpayers this is the most valuable education benefit, worth up to $2,500 per college student per year.
    Lawmakers also included a one-year extension of current "bonus" depreciation rules, which allow businesses to deduct up to 50% of the cost of a wide variety of property and equipment, excluding real estate.
    Estate and gift tax. The estate- and gift-tax exemption will remain at $5 million per individual—not the $3.5 million sought by President Barack Obama. But the current 35% top tax rate on amounts above the exemption will increase to 40%. These changes are permanent.
    The exemption will also remain indexed for inflation, so the 2013 amount will be more than the 2012 exemption of $5.12 million. The IRS hasn't announced the 2013 adjustment.
    In addition, the estate and gift tax will remain "unified," meaning an individual can use his or her entire exemption to make gifts while alive instead of waiting until death.
    In past years, the gift-tax exemption was often much smaller than the estate-tax exemption, which limited the early transfer of assets that were growing in value. The large gift-tax exemption provides many planning opportunities to the wealthy.
    The recently added "portability" provision also is permanent now. It allows a dead spouse's estate to transfer to the survivor any unused portion of the $5 million exemption. This means a married couple doesn't lose out on their total $10 million exemption simply because they didn't engage in predeath legal planning.
    Several restrictions advocated by the Obama administration also didn't make it into the law. Long-running "dynasty trusts"—which can shelter assets from estate taxes for hundreds of years—weren't limited to a maximum term of 90 years. "Defective grantor trusts," another estate-planning technique, don't have new limits, either.
    And the minimum term remains two years for another estate-and-gift-minimizing technique called a "grantor-retained annuity trust." The Obama administration and others wanted to trim its benefits by lengthening the term to 10 years.
    —Email: taxreport@wsj.com Write to Laura Saunders at laura.saunders@wsj.com

    Sunday, January 6, 2013

    Virtually All 2013 Outlooks Summarized: Part 1 - Short Version Summary, Conclusions


    Having reviewed the 2013 forecasts of at least most of the big names and institutions for the past weeks, here's a distillation of what they say about:
    • the array of bullish and bearish forces for 2013
    • what will determine which side of these wins out
    • the biggest questions and risks
    We'll add a few of our own conclusions and observations as needed.
    • Here in Part 1 we summarize the following
    • Part 2 covers the primary bearish forces risk asset markets confront
    • Part 3 covers the primary bullish forces supporting them
    • Part 4 covers conclusions and actions these suggest
    Unless otherwise noted:
    • We're attempting to capture the consensus view of 2013. When we offer our own thoughts, we'll state explicitly that we're speaking for ourselves.
    • When we use the term risk assets we mean assets that rise with optimism and fall on pessimism about future growth. Safe haven assets perform in the opposite direction. Understanding the distinction between these two asset types and what drives them is fundamental and critical for understanding how, why, and when markets move as they do.

    ONE SENTENCE SUMMARY: ALL DEPENDS ON WHETHER STIMULUS KEEPS WORKING

    We can expect more of the same as we saw in 2012 unless stimulus fails to prevent a contagion threat in the EU, US, other major economy.
    That's it.
    Our take: We're concerned about this view because
    • Stimulus is becoming less effective. In the US we're already seeing diminishing returns from it. QE 1 saw the S&P 500 index rise almost 70%, and for QE 2, the index gained 23%. So far, since QE III was announced in September 2012, the S&P had lost 4% as of yearend (though has since erased that loss in the wake of the post fiscal cliff deal rally).
    • If anything, it's more likely that there will be less easing in 2013 and that will ultimately put a drag on risk asset prices. For example whatever the fiscal cliff and debt ceiling deal that ultimately happens; it will contain at least some austerity measures. For example, as Comstock Partners note here:
    • The yearend deal still cuts GDP by ~1.5%, which is not insignificant given that the US is only growing about 2% per year.
    • Moreover, the coming debt ceiling deal is likely to add additional austerity measures, and the uncertainty from what will likely be a bitter fight over it, should further pressure risk asset prices.
    Here's a bit more detail.
    The S&P 500 index, as good an overall barometer of risk appetite versus risk aversion (aka optimism and pessimism) is widely expected to stay within about 14% of its 1426 close. Most expect a far smaller net result.
    While the balance of fundamentals are negative, most expect a flat to mildly positive year for risk assets because they believe aggressive and massive government intervention to prop up asset prices with debt and money printing will continue to work for 2013. It's understood that there will come a time when these supports need to be withdrawn. Meanwhile these policies can continue to support economies (in place of actual wealth creation and rising real incomes) as long as their primary dangers don't outweigh their benefits. These dangers are:
    • Inflation: Stagnant or falling real incomes and growth continue to keep inflation rates acceptably low
    • Currency Debasement: Despite a ballooning Fed balance sheet (and even bigger balance sheet expansion by the ECB and Japan) we see no signs of a major loss of confidence in these or other overprinted currencies. These currencies fluctuate but remain within decade trading ranges versus other major currencies, demand for sovereign and corporate debt denominated in these remains good enough to prevent a bond market selloff that overwhelms central bank efforts and sends interest rates higher.
    What to do? Income is getting emphasized over growth, given the very limited upside potential and likely essentially flat trading range of most risk assets.
    Where we differ from the consensus:
    • EU Crisis Risk Underestimated: We believe the most forecasts do not sufficiently price in EU crisis risk. That's ok as long as you're sure the past temporary solutions can continue to work. The US hasn't been any better at taming its own debt issues, however these do not present as imminent or large a threat as the EU, where insolvency and breakup are real possibilities.
    • Currency Diversification: Most 2013 forecast-related advice continues to underplay the risks of currency debasement implied by ongoing large scale monetary expansion. Just like you need to diversify by asset and sector class, so to you need to make sure your longer term portfolio is not too heavily exposed to the currencies at risk of debasement from aggressive printing and sovereign debt levels, like the USD, EUR, and JPY, among others. Our recently published book is all about a variety of ways to hedge this risk for both conservative traders and long term passive investors.
    • We are reluctant to take new long positions given that risk assets remain high and the chances of a pullback of 10% or more are very good given the bearish forces covered above and in later parts of this 2013 outlook. Considering that most moderate risk assets produce 3-6% yields, the opportunity cost of waiting for that pullback is small compared to the gains of buying on the dips.
    See here for an excellent piece by John Hussman how buying on the dips has become more important than ever since 2009, and also on the long term drag coming from the eventual rise in rates.
    Disclosure/disclaimer: No positions. The above is for informational purposes only. All trade decisions are solely the responsibility of the reader.

    Saturday, January 5, 2013

    Backwardation and Contango: Futures traders and commodity ETF investors who do not understand the difference can and will get burned

    Posted In Economics, Market Analysis| 2 comments

    Lets start by considering what futures contracts actually represent, and what backwardation and contango mean. (By the way, stick with me on this. It might seem a bit dry, but if you are new to trading futures contracts or commodity ETFs, It should vastly expand your knowledge in just 10 minutes). At the end I tie it together and explain how the forward curve is relevant to commodity speculators, investors, and traders.
    Futures prices for commodities represent the supply and demand balance for a particular commodity contracted to deliver or sell at a future date. One of the clearest ways to view this is with a graph that displays what is called the forward curve. The forward curve is a graphical representation of the current price of each futures contract over a period of time. Here is an example:
    The graph above displays the current price of each Natural Gas contract all the way out to the November 2016 contract. So, for example, if we look at the far right side of the graph, it looks like Nov. 2016 natural gas is priced at about $6.8/mmbtu.
    This means that a user of natural gas (say a power company) can purchase a November 2016 contract at about this price and lock in the cost of his future natural gas purchases. A natural gas producer (such as the companies Williams (WMB) or Chesapeake (CHK) can also lock in their prices, though in their case they are locking in the price they are able to sell natural gas at in the future. This ability to “lock in” future prices of commodities allows both commodity producers and users to make rational decisions over time and to focus on their core businesses (Exploring an for energy or generating and distributing electricity)
    Forward prices (as represented by futures contracts) play another critical role: They allow for the efficient allocation of scarce resources over time. How?

    Lets think about the forward curve for a moment as it relates to a natural gas producer. At any given time, the producer (Lets create a fictional company named NAS Natural Gas Co.) has the option of either selling current natural gas production in the spot market, or of putting it in storage and selling it at a future date. How does the NAS Natural Gas Co. trader make this decision?
    Well, the trader at NAS Nat Gas Co. knows how much it costs to store natural gas either because the company owns the storage facilities itself, or it is able to get a quote from a storage facility owner. He then takes this information and compares the cost of storage against the sale price he can lock in at different future contract maturity dates.
    Lets say (for the sake of example) the price of the Natural Gas futures contract that expires in 6 months is $1.5 higher than the spot price, and the storage cost is equal to $.50 for the volume represented by one futures contract. In other words, the scheduler has found that by storing Natural Gas for six months, he can lock in an additional $10,000 revenue per contract on his sale of National Gas. (The NG futures contract is priced such that each $1 price increment is equal to $10,000).
    The NAS Natural Gas Trader will compare this return to what is available in the spot market and to other futures contracts. If he finds that this is the most profitable option, he will make the trade. If the spot market proves to be the most profitable, he will not use a futures contract, but will rather just sell the current natural gas supply in the cash (immediate delivery) market. Much of this trading is done using swaps, however the basic principles are the same.
    Now, WHY was the 6 month forward contract priced in a way that made it profitable for the NAS Natural Gas Co. to sell this contract? It is our example, so we will make up a reason:
    In this case, it is because Peidmont Natural Gas (PNY) had a heavy need for gas six months from now (during the cold winter season), and had been bidding up the price. The Trader at NAS Natural Gas Co. has computer program that help him to analyze these types of arbitrage situations. Because NAS Nat Gas Co. has the benefit of very low storage costs, he was able to get to this trading opportunity ahead of other natural gas producers (Remember, this is just a simplified example to clarify the basic concepts).
    There you have it. If you followed this example, you understand how forward prices work to effectively allocate scarce resources over time. Forward prices created an incentive for NAS Natural Gas Co. To sell their gas production at the moment in the future where it was most needed.
    The demand for forward contracts and for storage in commodities such as natural gas is to a significant extent driven by seasonal patterns of production and consumption. One of the best resources for better understanding, tracking, and learning to profit from these seasonal patterns can be found here. (I am proud to have an affiliate agreement with this company, as I believe its services and research reports offer significant practical and educational value).
    How does this all relate to commodity speculators, traders, and investors? There is good news: The slope of the forward curve gives price signals not just to commercial interests, but also to speculators. It can provide a strong clue as to whether a long or short position will (all else equal) be profitable in a given market.
    Lets look at a specific situation in Nat Gas over the past year. Here is a weekly price chart of Nov 2011 Natural Gas:

    As you can see, the Nov 11 contract started the year at $5.185, and is currently at about 3.681, for a price decline of $1.324. This is equal to a loss of $13,340 per contract. How did the spot price perform during this time? Lets look at a price chart of the spot price:
    The Natural Gas spot price started the year at 4.54, and is currently at 3.63. For a loss of $.91, or $9,100 per volume equivalent of one futures contract.
    Notice that the November futures contract lost over $4,000 more (For an equal volume of Nat Gas) than the spot price over the same period of time! This was entirely do to the Decline in the forward premium as the contract approached its expiration date. This happens because as time passes, the futures price converges on the spot price. At the expiration date the “Futures” contract is no longer in the future, it is the present and therefore equal to the spot market.
    In other words, if there is a significant premium in forward contracts and the spot price does not move at all, the futures contract will suffer a price decline equal to the forward premium.
    Think about this for a minute. What it basically means is that if one sells short a contract in steep contango (contango is when forward prices are higher than the expected future spot price, and the curve slopes upward), the actual price of the underlying commodity does not even need to go down in order for the short seller to profit.
    Lets look at the current market:
    Currently, the Nat Gas spot price is about 3.63. Lets look at my quote board for the Nat Gas contract going out to March 2012:

    Look at the Jan 12 Futures contract. It is currently selling for $3.923, or $.293 more than the current spot price. This means that if the spot price does not change at all from now until the January contract expires, the contract will lose $2,930 in value. Talk about a headwind for long positions!
    Is there a catch? Yes, absolutely. The forward curve can and does change. Also, Any event that alters the supply/demand situation (such as a supply disruption or an unexpectedly cold winter) can send the price of the January 12 futures contract soaring. For this reason it is important for speculators to always have a planned risk limit on each and every trade. Basically, the speculator wants to get in and take advantage of the slope of the forward curve, while protecting himself from any adverse price spikes. In a sense it is not all that different from selling option premium (for those of you who are familiar with that concept).
    An inverse situation applies when forward contracts are trading at a discount to the expected spot price. This is called backwardation. Research has demonstrated that most all of the net return generated by holding futures contracts long occurs in contracts that are trading at a discount to the spot price. The dynamics are exactly the same as in the above Natural Gas example, only in reverse.

    Lets look at Sugar. The current spot price for Sugar #11 is 31.05. The march 2012 contract is priced at 27.66. (The Sugar #11 contract is priced such that each .01 = $11.20). This means that the March contract is priced at a 3.39 discount to spot. In other words, if the spot price does not move at all from now until this contract expires, the Contract will gain about $3,800 in value! That is quite a tail wind for any long positions, and provides a clue as to why research has demonstrated that any return earned from holding futures contracts (on average) occurs in markets that are in backwardation.
    The bottom line:
    • Speculators should be biased towards long positions in contracts that are in steep backwardation, and short positions in contracts that are in steep contango.
    • The forward curve should never be the only factor a trader looks at, however it is something worth studying and tracking in each market the trader is active in.
    • ETF investors: DO NOT invest in commodity ETFs when the underlying commodity is in steep Contango! The negative roll yield can put a colossal headwind on any potential return. In fact, at times it can be so severe it almost seems that the losses are guaranteed. Just look at a long term price chart of VXX (VIX ETF) or UNG (Natural Gas ETF) to see how true this really is.
    If you enjoyed this article, make sure to read, “Trading VIX futures and the VXX ETN: Forward curve, momentum, and inter-market effects to be aware of