

Highlights
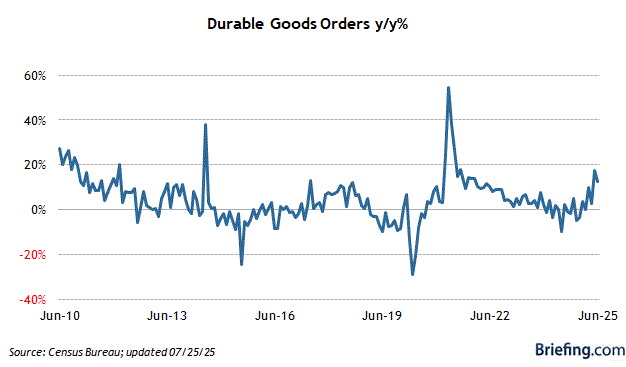
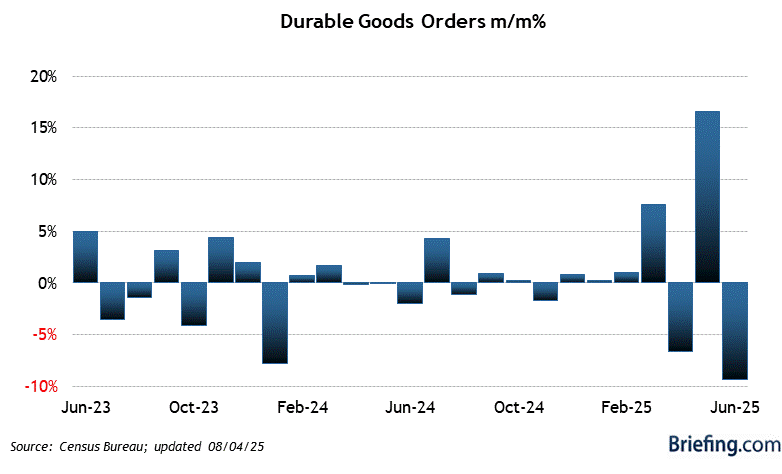
- The advanced durable goods report would suggest that manufacturing activity is headed for a slowdown in the coming months as durable goods orders increased only 0.3% in July.
- The Briefing.com consensus expected orders to increase 3.0%.
- Orders excluding transportation fell 3.8%, well below the consensus forecast of 0.5% growth.
Key Factors
- Volatility in aircraft orders over the past several months has made movements in durable goods orders difficult to track, and July proved no different. After declining 25.3% in June, aircraft orders increased 75.9% in July. The jump in demand for aircraft kept the headline orders growth level in the black.
- Excluding transportation, the growth pattern in production has been much more stable since October 2009. Since then, manufacturing orders have fallen in the first month of the quarter before rebounding during the next two months.
- This pattern held in July.
- The only difference this month from the previous quarterly trends was the size of the drop. Orders fell at the fastest rate since January 2009 and it would take a much more sizable increase in orders over the next two months to pull it back into positive territory for the quarter.
- Business investment has also followed this trend since October. In July nondefense capital goods orders excluding aircraft fell 8.0%. We expect orders to rebound next month.
- Shipments of nondefense capital goods excluding aircraft were revised up from 0.5% to 1.0% in June. This should give a slight positive bump to the second quarter GDP revisions.
Big Picture
- Durable goods order trends have been extremely postive since late 2009. That reflected a revival in consumer demand and lofty expectations for continued consumption growth. While bank credit remains tight, large firms have been able to take advantage of low yields by issuing their own debt for capital purchases.
| Category | JUL | JUN | MAY | APR | MAR |
|---|---|---|---|---|---|
| Total Durable Orders | 0.3% | -0.1% | -0.7% | 2.9% | 0.1% |
| Less Defense | 0.3% | 0.2% | -0.6% | 3.4% | 0.0% |
| Less Transport | -3.8% | 0.2% | 1.4% | -0.9% | 4.9% |
| Transportation | 13.1% | -1.1% | -6.6% | 15.4% | -13.2% |
| Capital Goods | -2.7% | 0.2% | -0.8% | 6.3% | -5.7% |
| Nondefense | -2.8% | 1.2% | -0.4% | 8.1% | -6.7% |
| Nondefense/nonaircraft (core cap gds) | -8.0% | 3.6% | 4.7% | -2.8% | 6.7% |
| Defense Cap Goods | -2.2% | -5.6% | -3.4% | -3.1% | 0.0% |
No comments:
Post a Comment