Summary
- Crude oil prices closed down 4% yesterday, breaking through a 2-month support level at $57/barrel, after an EIA report showed an unexpected build in inventories.
- I argue that the domestic supply/demand balance has not improved and is just as bearish now as it was last winter when oil was in free fall.
- Based on my analysis of supply/demand data presented in this article, I believe crude oil has further to fall.
- My trading strategy, including holdings, price targets, and entry/exit points are discussed in detail.
In yesterday's Petroleum Report for the week ending June 26, the EIA announced that crude oil inventories increased by 2.4 million barrels, versus the analyst consensus for a 2-million barrel storage withdrawal. The storage build was also markedly bearish compared to last week's 4.9 million barrel withdrawal, last year's 3.2 million barrel withdrawal and the 5-year average 4.1 million barrel withdrawal. It was the first storage injection in 9 weeks since the week ending April 24. Storage injections during the final week of June are highly unusual, and last week's build was the first storage injection during the last week of June since the week ending June 29, 2007, and only the third this millennium.
At 480 million barrels, total crude oil storage is 90 million barrels above the five-year average inventory level and 80 million barrels above last year's level, versus a 84 and 75 million barrel surplus last week, respectively. The increase in crude oil surplus is a sharp departure from the past two months which had seen surpluses, versus the five-year average decline in 8 of the past 9 weeks from a peak of over 113 million barrels. Figure 1 below shows the storage surplus versus the five-year average and 2014 over the past year.
(click to enlarge)
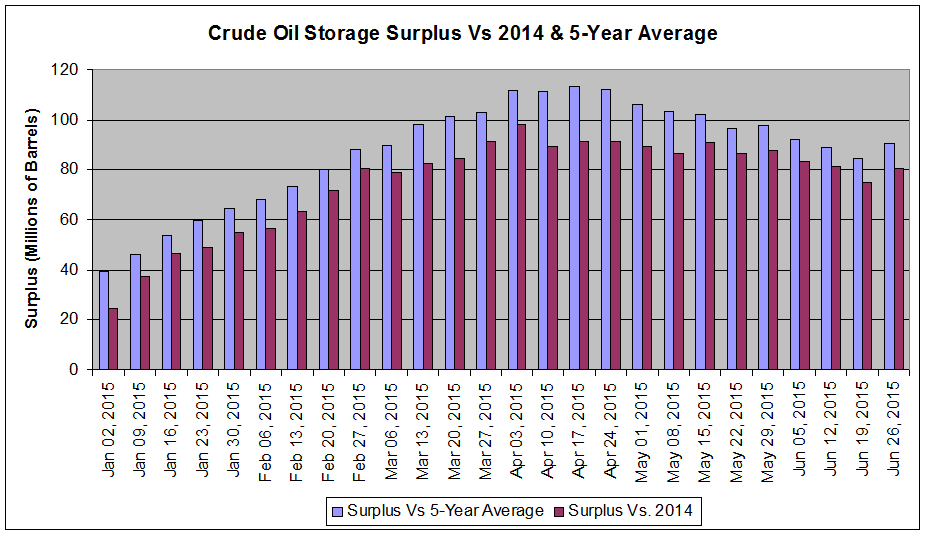
Figure 1: Crude oil storage surplus versus 2014 and the 5-year average showing an increase in the surplus after several weeks of decline. [Source: Chart is my own, data from the EIA.]
What happened over the past week that led to such an abrupt change in crude oil supply/demand balance?
Not much, I argue. And that is the problem.
There are three components of US supply/demand balance - domestic production, demand (measured by refinery inputs), and imports.
Domestic production was largely unchanged last week, declining by 9,000 barrels per day, from 9.604 million barrels per day the previous week to 9.595 million barrels last week. Domestic production remains at record highs, despite an oil rig count that has fallen 60% since October. Production is up 1.2 million barrels year-over-year.
Crude oil demand was likewise flat week-over-week, declining a negligible 1,000 barrels per day last week to 16.531 million barrels per day. Demand is up 313,000 barrels per day year-over-year. Note that this is well shy of the 1.2 million barrel per day year-over-year increase in production. As a result, the purely domestic supply/demand picture - demand minus US production - is markedly loose compared to last year. Figure 2 below compares the purely domestic supply/demand picture for 2015 versus 2014.
(click to enlarge)
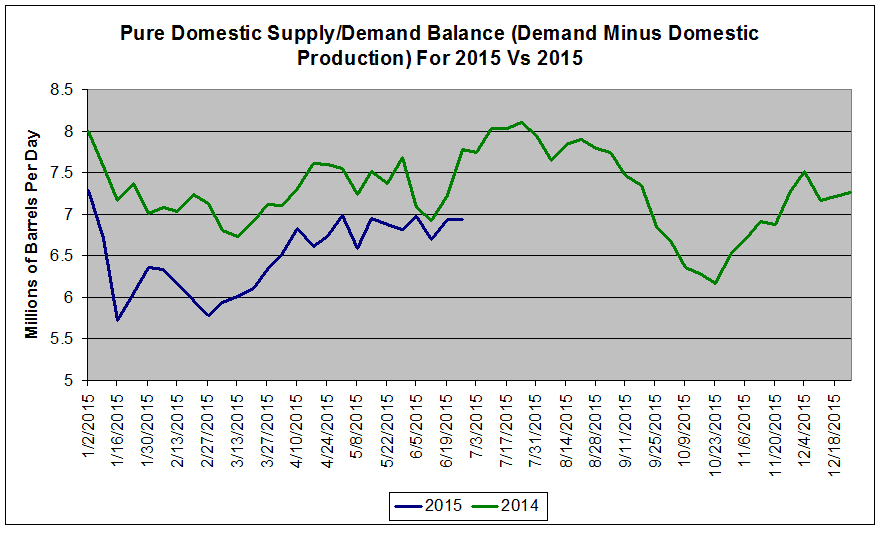
Figure 2: Purely domestic crude oil supply/demand balance equal to demand minus domestic production. Supply/demand remains loose to 2014 and has been flat over the past 2 months, indicating minimal tightening of the market. [Source: Chart is my own, data from the EIA.]
Note that last year at this time, demand exceeded domestic production by 7.8 million barrels per day, while last week, this spread was just 6.9 million barrels. Further, despite all of the hullabaloo over record demand and declining domestic production, this spread is sitting near the 2015-to-date average of 6.6 million barrels, and has been essentially flat since late April.
It is the third component of the US supply/demand picture - imports - that drove last week's bearish storage build and had been masking the persistent supply/demand mismatch shown above in Figure 2 that allowed crude oil to rally more than 30% off the March lows. Imports increased by 748,000 barrels per day last week to 7.513 million barrels per day. It was the largest week-over-week increase since the week ending April 3rd and the largest daily average since the week of April 17th. Nevertheless, the 7.5 million barrel per day tally was a mere 170,000 barrels per day above the 1-year average import level. Figure 3 below plots crude oil imports versus the 1-year average over the last 12 months.
(click to enlarge)
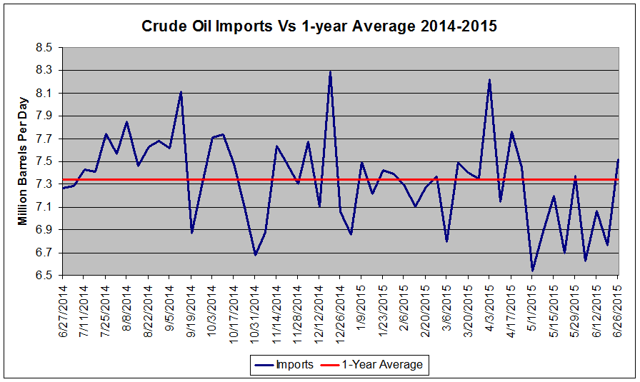
Figure 3: Crude oil imports versus the 1-year average. After 2 months well below the 1-year average, crude oil demand rebounded last week. [Source: Chart is my own, data from the EIA.]
Note that after hovering in the 6.75-7.25 million barrel per day range since late April, last week's imports were merely a return to the baseline. Furthermore, imports have room to go even higher. Figure 4 below shows the week-over-week change and the departure from 2015-to-date average imports by country.
(click to enlarge)

Figure 4: Crude oil imports by nation with week-over-week and departure versus the 2015 average included. While imports from Canada rebounded last week, large deficits versus the 2015 average remain in Canada, Saudi Arabia, and Mexico. [Source: Chart is my own, data from the EIA.]
Note that the second-largest weekly increase in imports last week came from our biggest oil trading partner, Canada, where imports increased by 142,000 barrels per day. However, thanks to persistent wildfires in Alberta's prolific oil sands, imports are still 187,000 barrels per day below their 2015 average. As these wildfires have largely diminished, I expect Canadian imports will continue to increase, from 2.8 million barrels per day last week back to their 3.0 million barrel per day 2015 average in coming weeks. An even more impressive departure versus the 2015 average was seen in Saudi Arabia, where imports remained flat at 700,000 barrels per day last week, more than 250,000 barrels below their 2015 average of 992,000 barrels per day. Saudi Arabia is a country whose rig count is at record highs and which is spearheading the effort to destroy the US shale oil industry, so I expect these imports will recover rapidly over the next month. Finally, our third-largest trading partner, Mexico, saw its imports slide 290,000 barrels per day last week, and currently sit 215,000 barrels per day below its 2015 average - likely another short-term anomaly. Were just these three countries to have had their imports at 2015 baseline levels, last week's storage build would have been a massive 7.1 million barrels. The gains seen in Venezuela, Kuwait, and other smaller trading partners that sent tallies above their 2015 averages may be at least partially attributable to a surge in Gulf Coast imports following delays caused by Tropical Storm Bill, and therefore, may decline in coming weeks. However, I expect the net change in imports to be upwards over the next month, putting further pressure on the supply/demand balance.
My rationale for emphasizing imports compared to US production and demand is that I believe that they have been artificially creating the appearance of a tightening supply/demand balance. Thanks to wildfires in Canada, Tropical Storm Bill interrupting shipments in the Gulf of Mexico, and unrest in the Middle East, imports during April, May, and early June (as shown in Figure 3) were depressed below the five-year average. This correlated strongly with a transition to storage withdrawals that helped to fuel the back-end of crude oil's 30% rally from the March low of $43/barrel to $61/barrel. Figure 5 below compares crude oil weekly storage injections/withdrawals to imports.
(click to enlarge)
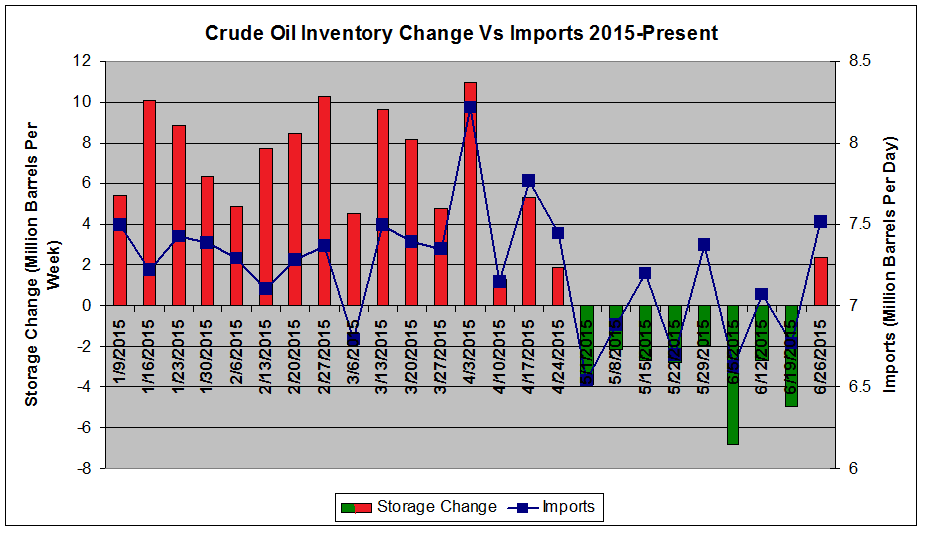
Figure 5: Crude oil storage changes versus imports. There is a strong correlation between storage withdrawals between May and late June and a decline in imports. Storage injections resumed last week, following a surge in imports. This supports imports being the major driver of the domestic supply/demand balance over the past few months. [Source: Chart is my own, data from the EIA.]
During this same period (as shown in Figure 2), domestic production and demand remained relatively unchanged. As a result, I firmly believe that the decline in imports hoodwinked many investors into thinking that the supply/demand balance was permanently tightening, due either to increasing demand from cheap oil or declining production from the declining rig count, when it was really a temporary drop in imports. Now that imports have returned to a baseline level, this "masking" of the supply/demand balance has been lifted, and the result was a bearish injection similar to those seen during oil's springtime free fall - but during a time when the market expects withdrawals. It is therefore unsurprising that oil retreated to the tune of 4% yesterday.
What I believe to be even more concerning is that there is little room to go higher on the demand front. Refinery utilization - the percentage of US refinery capacity that is being utilized to convert crude oil to gasoline and other finished products - was at 95.0% last week. This is the highest refinery utilization during the final week of June over the last 10 years. Figure 6 below shows refinery utilization for the last week of June from 2006 to the present.
(click to enlarge)
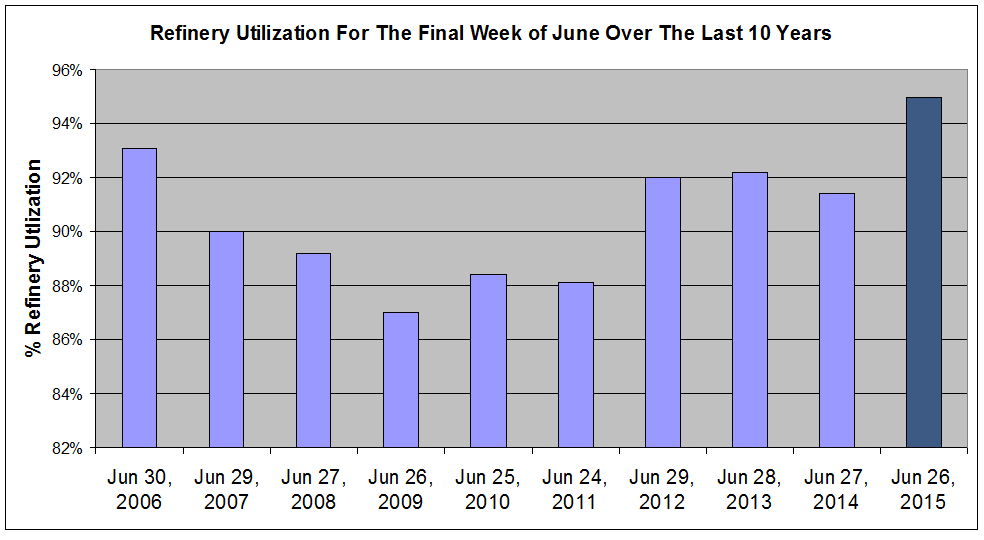
Figure 6: Refinery utilization during the final week of June for the past 10 years showing that, at 95%, 2015's utilization is the highest of the decade. [Source: Chart is my own, data from the EIA.]
Furthermore, the maximum refinery utilization during any week in the last 10 years was 95.4%, recorded several times, most recently last December. As a result, at 95.0% refinery, utilization is nearly at its maximum capacity. The fact that we saw a 2.4 million barrel storage injection, with demand near its maximal level pulling hard at crude oil inventories and with imports still with room to run higher, suggests to me that oil still has room to fall.
Oil's 4% decline to under $57/barrel represented a major breakdown not only from a fundamental level, as discussed above, but from a technical level. During the 44-day period from April 29 to June 30, crude oil had traded within a tight $4.17 range between $61.43/barrel and $57.26/barrel, the narrowest range since March 2004. Oil broke out of that range yesterday. Figure 7 plots the price of crude oil over the last 3 months, showing the rally, range-bound action, and the breakdown yesterday.
(click to enlarge)
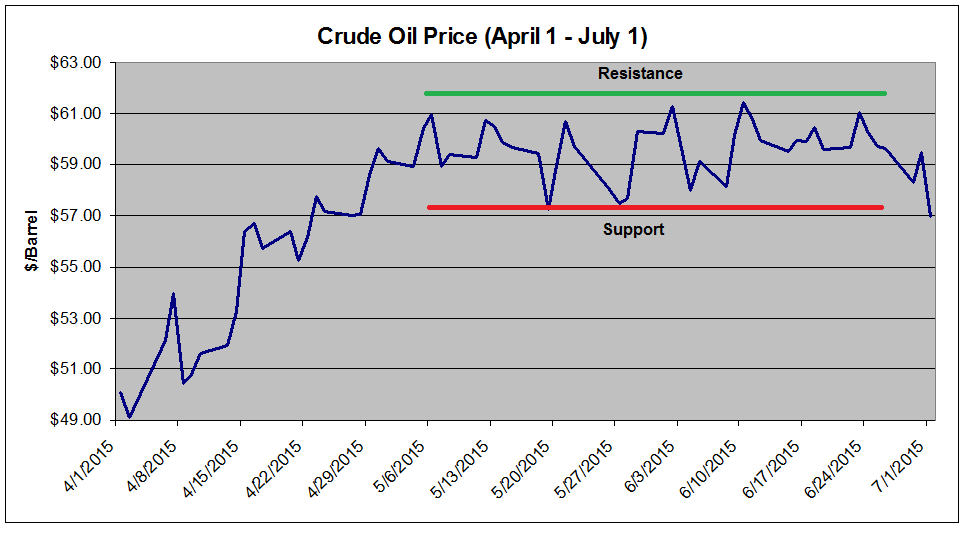
Figure 7: Crude oil prices over the last 2 months showing range-bound trading largely between $58/barrel and $61/barrel. followed by a breakdown yesterday. [Source: Chart is my own, data from the EIA.]
Now that oil has fallen below its 2-month support level, I would not be surprised if more investors head for the exits.
I continue to hold three positions betting on a continued downtrend in crude oil prices. I own a 10% short position in the popular United States Oil ETF (NYSEARCA:USO) - increased from 5% last week - a large 15% short position in the leveraged VelocityShares 3x Long Crude Oil ETN (NYSEARCA:UWTI), and a 5% short position in the Market Vectors Russia ETF (NYSEARCA:RSX). The latter provides short exposure to an oil-driven economy, as well as the turmoil encompassing Europe. The short UWTI position is a higher-risk play on leverage-induced decay due to choppy trading. USO, of course, is a safer direct play on declining oil prices.
Should oil drop to $55/barrel - which has long been my short-term price target - I will begin to aggressively cover my UWTI short position to protect profits in a highly volatile trade, which is currently up 20% and would likely be pushing 35% if oil reaches $55/barrel. I will likewise plan to close out my RSX short around the same level to lock in profits, should the European crisis appear to be resolving.
However, I plan to hold USO for the foreseeable future. Following yesterday's decline, contango in the oil futures market is again rising, with the 4-month spread up to $1.21, or 2.2%, after bottoming out at $0.86 last week. Should oil continue to fall, the contango will likely widen further, and I could easily see contango-generated returns topping 5% on a position held through the Fall. I feel USO is a safer, less volatile long-term hold than UWTI (despite the fact that UWTI triples the contango-generated gains and also benefits from leverage-induced decay). My price target to close out my USO position is currently $50/barrel. Factors that would likely cause me to cover sooner would include any socioeconomic forces that look like they would suppress imports for an extended period, or if US production (finally) begins declining in a meaningful way. As a result, my "stop" is a fundamental stop, and I do not have a specific stop price. Should oil rally in the face of the current bearish fundamentals, I will even consider adding to my USO short position up to 15%. If I had no crude oil short exposure, I would be reluctant to open a position here with oil down 7% in a week. Rather, I would wait for a bounce before initiating any position.
In conclusion, I believe that US crude oil demand and production remain in a stable, bearish pattern. Instead, the fundamental supply/demand picture is, and has been, dictated by fluctuations in crude oil imports. I do not believe that the underlying fundamental picture has changed since March, and that a return to baseline import levels last week following months of temporary suppression unmasked this persistent supply/demand imbalance. With crude oil demand unlikely to go higher with refineries near peak capacity, domestic production stable, and crude oil imports with room to go even higher, particularly from Canada and Saudi Arabia, I expect continued weakness in crude oil in the months to come. Once the summer driving season fades and demand declines, I would not be surprised to see the domestic oil surplus climb back above 100 million barrels over the next 1-3 months. Further exacerbating bearish sentiment are the possible resumption of Iranian exports and continued anxiety over Greece and the eurozone, although I believe these fears to be secondary to the ongoing domestic storage glut. My 1-3 month price target is $55/barrel, with a potential to drop as low as $50/barrel during this time. As a result, I plan to hold my large basket of crude oil short positions in USO, UWTI, and RSX.
Additional disclosure: As noted in the article, I am also short RSX and UWTI.
No comments:
Post a Comment