ETF Leverage Lesson, With A 25% Profit Prize!
Mar 5 2013, 13:37 | includes: SVXY
Disclosure: I have no positions in any stocks mentioned, and no plans to initiate any positions within the next 72 hours.
The focus of this article is not our usual comprehensive set of comparisons of nine or ten different groups of Exchange Traded Funds, but will put its attention just on those ETFs that have leverage built into their structure, so that their prices can reflect multiples of the price change being experienced by the underlying instrument(s) (usually an index) that is being tracked by the ETF.
These creations, initially introduced several years ago by ProShares, come in two flavors, long position multipliers and short position ones. The effects are created by employing derivative securities to produce a (2x) magnifying impact, and margin treatments or other techniques to further extend the achievement to a (3x) result.
Originally the leverage markets were imagined to be of public (individual investor) interest, much as margin borrowing can attract certain stock investors. But the vendors (and the customers) quickly learned that for the leverage effect to be maintained over time and through progressive price changes, the proportions of contributing elements (derivatives) needed to be adjusted on a daily basis.
The adjustment need is more evident with inverse (short-structured) ETFs than with levered-long ETFs tracking indexes that maintain fairly persistent upward trends. But the presence of the problem and the need for its correction by the vendors on a daily basis, can make it unsuitable for any long-term investor, and it becomes particularly detrimental in certain cases where inverse ETFs are being held for several days in turbulent times.
Many individual investors have come to the conclusion that inverse-levered ETFs are a "don't try this at home" proposition.
Instead, they are typically sought by investment professionals as hedges or other portfolio engineering tools, on a one-day-at-a-time balancing act, where, properly used, they can provide certain risk-management benefits.
Levered-long ETFs, in limited-volatility situations, can often provide exceptionally attractive returns, where market direction has beencorrectly foreseen.
Here is an illustration of how well leveraged-long ETFs of the Dow-Jones 30 Industrials Index (DJIA) have fared over the past year.
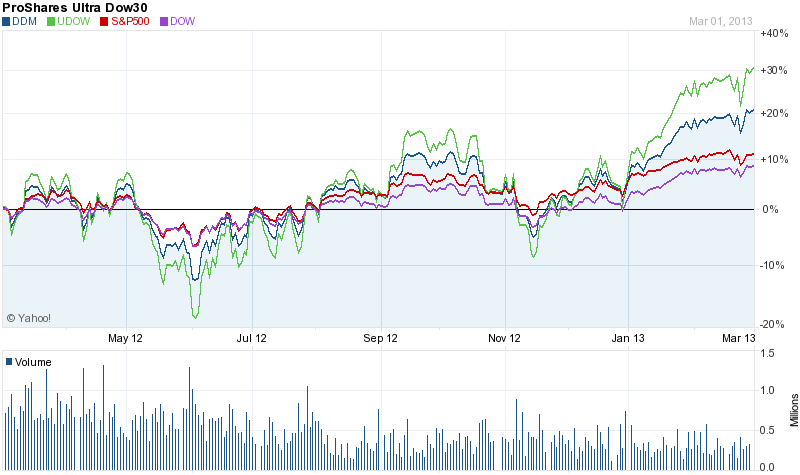
(Click to enlarge)
This picture shows the percentage price changes continuously since early March of 2012, in the DJIA index in purple, the ProShares Ultra Dow 30 (DDM) in blue, the ProShares Ultra Pro Dow 30 (UDOW) in green, and the S&P 500 (SPX) for later comparisons, in red. DDM is a (2x) of the DJIA, and UDOW is a (3x) of the DJIA. DJIA and SPX are not leveraged.
On the right-hand vertical scale it can be seen that when the DJIA and SPX dipped briefly by -5% between May and June of last year, positions bought at the beginning of March in the DDM fell more than 2x-5%, or about -12%, and those in the UDOW were down more than 3x-5%, or about -19%. The same positions later in September-October while the DJIA rose by some 5% were up by about +10% in the 2x DDM, and by 15% in the 3x UDOW, as intended.
Currently, the DJIA is about 9% ahead of its year-ago start, and the 2x DDM is up 20%. The 3x UDOW is ahead by 30%. The leverage is working well here, and rescaling the instruments to maintain daily change proportions is not a problem; if anything, it provides a little bonus - at least at the moment.
Now let's look at what happens to short leveraged (inverse) ETFs in an unfavorable (to them) market period. This picture shows the S&P500 index (SPX) in yellow, and the Russell 2000 small-cap index (RUT) in blue, as the base-line long index comparisons. The inverse ETFs shown are ProShares Short Russell 2000, (RWM), an unleveraged short of the RUT index in green, ProShares Ultra (2x) Short Russell 2000 (TWM) in red, ProShares Ultra Pro (3x) short Russell 2000 (SRTY) in purple and the Direxion Daily Small Cap Bear ETF (TZA) in gold, essentially a (3x) duplicate of SRTY.
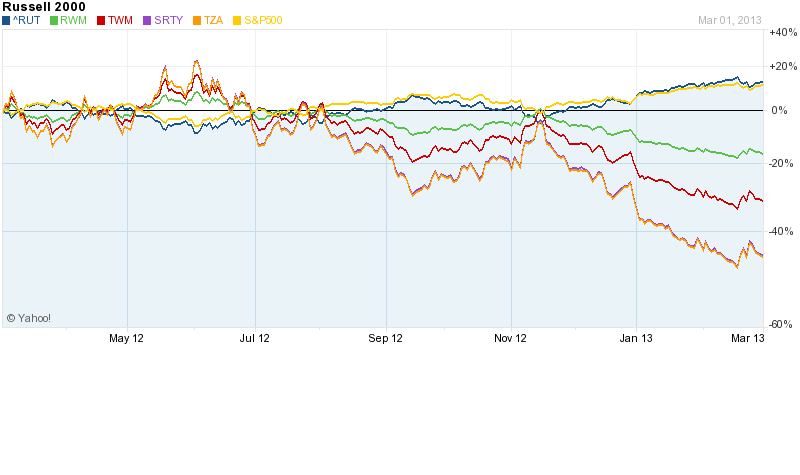
(Click to enlarge)
Since the inverse ETF prices should go up in a down market, they go down in an up market, like we have here for the most part. Remember, in May-June of 2012 the S&P declined -5% and the RUT a bit more, about -7-8%. In that period the short-structured ETFs rose by about equal amounts for RWM, double for TWM, and triple for SRTY and TZA. So far, little problem from the logic.
But a skip to the present clarifies the problem. With the RUT up a bit more than 12% over a year earlier, the RWM should be off by that amount instead of by -18%. The 2x TWM is down -30% instead of -25%, and the SRTY and TZA are down a crippling -45% or more, instead of "only" a staggering -35%.
Leverage always cuts both ways, but it looks like the back (short) edge of the leveraged-ETF broadsword is more dangerous than the front edge. Better not to mess with it anywhere, let alone "at home" unless you are an experienced (supervised) professional short-term trader.
Still, there are often enticing and attractive twists to what is ordinarily apparent. There is a very productive inverse ETF that has done extremely well during this past year, and longer. It is the ProShares Short VIX Short-Term Future ETF (SVXY). It has done so well because its underlier goes down when the market goes up. So it is a double-negative, a short of a short.
This picture (purple line) of its past-year relationship to the S&P 500 Index (SPX) in yellow and to the leveraged long SPX ETFs, the ProShares Ultra (2x) S&P500 (SSO) in blue, the ProShares Ultra Pro (3x) S&P500 (UPRO) in green, and the Direxion Daily Large Cap Bull 3x, (SPXL) in red, should be of particular interest as we discuss leverages.
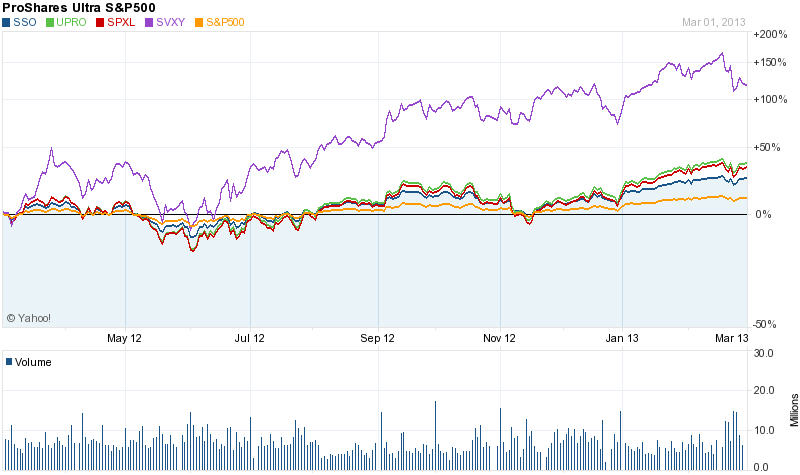
(Click to enlarge)
The VIX index is a measure of the uncertainty embedded in and implied by the option prices being paid at each market moment on SPX index options. This is more extensively discussed here (SA article).
As explained there, options are really insurance policies on the future movement of prices. They utilize the expertise of investment professionals to provide asymmetric risk protection at economical cost, another way of describing limited-liability leverage.
A quick study of the picture above reveals that in the past year it was possible to lose money in a position in SVXY, but it didn't happen very often or by very much. One had to be very unlucky. Early in the year a +50% gain could have turned into maybe a -10% loss briefly in the June market dip. But after that it was just "hang onto your hat!"
Of course, after the fact it all looks so easy. But after you have doubled your money by September, what makes you hang on for another 50% gain? And did you get out before it started to sour in the past couple of weeks? So, what do we do now? Who knows?
As they used to say on the "radio" (before TV got here), "Who knows? - The Shadow does!"
The market "Shadow" is that community of folks that make livings at a scale that most of us would love to enjoy, even if only for a couple of years - the market-makers. The joy of this deal is that not only is there an ETF that produces enormous profit potential in good years, there are options regularly traded on the ETF. Buy the options? When? What expirations? How long (in price gains) to hold them?
Are we getting greedy? Is greed really good? How about getting smart in the process?
The smart approach is to let the options tell us when to buy the ETFs (whose prices do not decay just because of the passage of time), and tell us how far (in price) to hold them. Also after we get off, the options can tell us whether we should take the ETF for another ride, when to do it, and for how far this time?
It could be done. It is being done.
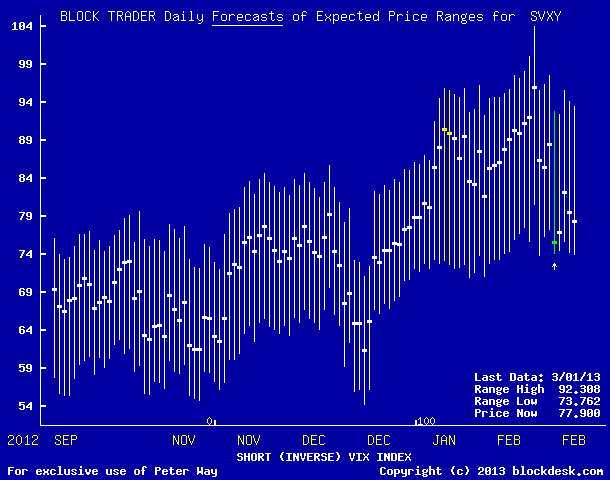
(Click to enlarge)
(used with permission)
This picture reveals how daily market-maker SVXY expectations have evolved over the past 6 months.
The market-maker activity in SVXY shares (currently over 1 million shares a day) produces hedging that leads to very useful price range forecasts, as suggested above.
Most recently when approaching the 90 price level, the extended downside price exposure warnings (from the heavy current-price dots to the bottom of the vertical forecast range lines) got sufficiently fulfilled such that new buy opportunities were flagged in the mid 70's shortly thereafter.
As outlined in earlier articles we regularly test the market-makers daily forecasts against what has actually transpired in the markets over the next three months.
We get indications of what the odds for higher and lower prices are, at every level of balance between upside prospects and drawdown exposure, and measures of how big the issue's ballpark may be, in terms of average gain day sizes have been, and what were the worst drawdown experiences encountered.
Then we put possible buys to the test of a 3-month holding limit, with high-price-forecast sell targets if reached before that deadline.
Using Friday's forecast of a +18% upside and a possible -5% drawdown, a Range Index of 22, prior outlooks of a similar balance only occurred seven times in the past year. All reached their sell targets in six weeks or less, averaging gains of +25% just during those holding periods.
Seven results is too small a sample to be very comforting, so we took a Range Index of 40, larger than any currently being encountered, and went back to the earliest available forecast almost a year ago. Using that imbalance of only one and a half times as much upside as downside, we have a larger sample of 41 prior outcomes with our time-limited strategy.
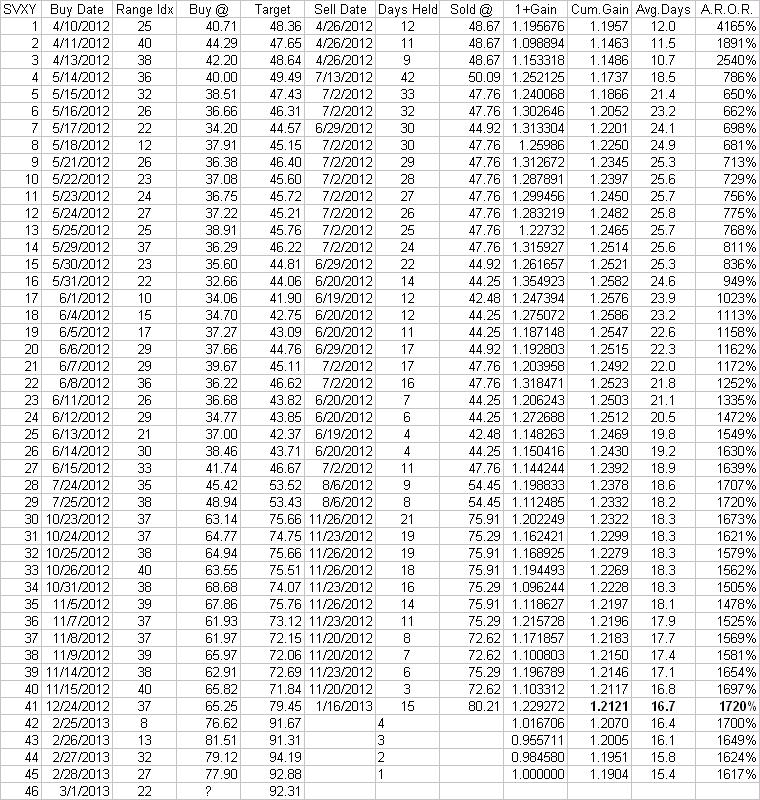
There, all 41 but one reached their sell targets within seven weeks and had an average holding period of less than 4 weeks (despite the one at over 8 weeks). The profits averaged a bit over 21%, which is a day rate of over 1% (or some 1200% a year). Here is the test trade log showing the details:
(Click to enlarge)
Lines through 41 show buy guidances that would be closed out by now. Lines 42-46 have only recently been instituted and are open positions, as indicated by spaces in the Sell Date and Sell @ (price) columns. The open positions have been marked to the market's last available price of $77.90, with cumulative results brought forward. Average gains including the open positions of +19% in less than 16 days are still a day rate of over 1%.
The boldfaced data of line 41 shows that gains of 21+% could have been captured this way in holding periods averaging less than 17 days. A Mafia money-lender charging 500% a year rates to lend the capital for investment would still have left the borrower over 2/3rds of the gains, and his/her knees intact.
If the exception proves the rule, then the SVXY short-ETF appears to have great current appeal as a long purchase. But don't get confused. You would be buying (not selling) an instrument designed to go down (not up) when what it tracks goes up (not down). And you might use the forecasts of higher (not lower) prices to tell when to sell this strange animal out of your portfolio of other long positions. What fun!
For gosh sakes, don't even think about hedging such a decision! Just go make some money!
No comments:
Post a Comment