Wednesday, March 26, 2014

Part V: Hedged Convexity Capture Continues To Be The World's Best Performing ETF Strategy

Summary
  • Long-biased Hedged Convexity Capture continues to destroy the S&P 500.
  • Investors are wasting their time with tired, archaic, complex strategies.
  • Brilliant quantitative insights will continue to dominate.
"Good ideas are not adopted automatically. They must be driven into practice with courageous impatience."
--Admiral Hyman Rickover
Previously, we explored long-biased Hedged Convexity Captures, a strategy which seeks to capture the negative convexity associated with leveraged ETPs. The idea behind Hedged Convexity Capture, as I outline in my book, is to capture the potential returns from shorting leveraged inverse equity ETPs with lower drawdowns and far higher Sharpe ratios than by just shorting them outright. The strategy seeks to accomplish this by shorting leveraged inverse equity ETPs like TZA (TZA) and pairing that short with a short position in TMV (TMV), an inverse leveraged long bond ETP.
Not only does shorting TMV often provide a hedge for the equity portion of the strategy, but TMV itself suffers from negative convexity, further increasing the effectiveness of the long bond hedge.
As before, we will use some simple rules, but this time, will focus on long-biased Hedged Convexity Capture using the 3X inverse small cap ETP, which suffers from excellent negative convexity. We shall efficiently capture this negative convexity in a hedged manner with the following rules:
I. Short TZA with 50% of the dollar value of the portfolio
II. Short TMV with 50% of the dollar value of the portfolio.
III. Rebalance weekly to maintain the 50%/50% dollar value weighting between the two instruments.
Here are some graphs of the results:
(click to enlarge)
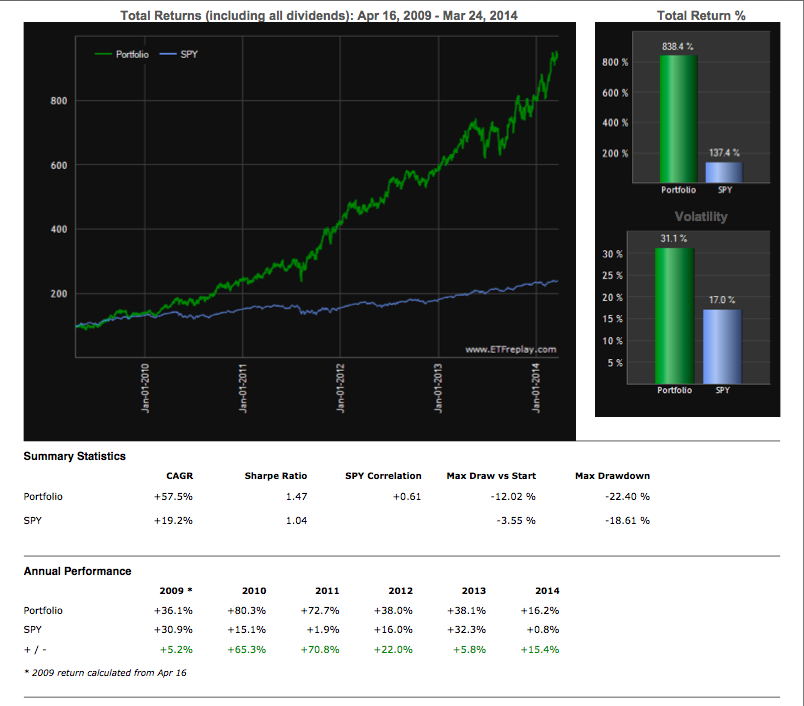
The graph above has a linear scale. The log scale graph is below:
(click to enlarge)
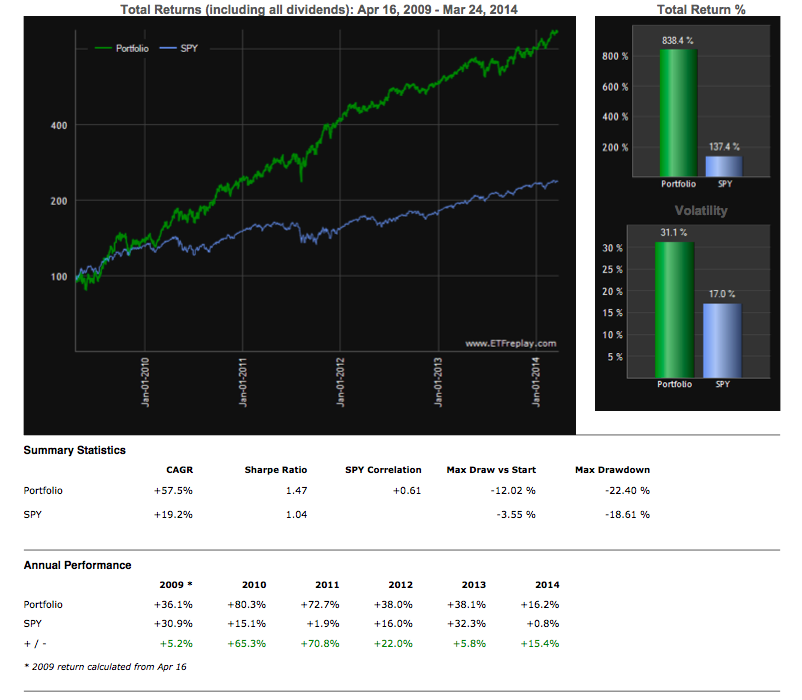
What's fascinating about this strategy is that it actually accomplishes what other strategies purport to. It outperforms the S&P 500's SPY (SPY) ETF by 38 percentage points per year, it consistently outperforms the S&P 500 in every calendar year since inception of the strategy, and it does so with a smoother ride. I have absolutely no idea why people would be interested in individual stock ideas, or complex strategies which use dozens of stocks, when they can use a strategy which can be executed easily with two instruments rebalanced weekly. The fascination of the public with complication, rather than with mathematical elegance, continues to amaze me.
Clearly, this strategy massively outperforms the S&P 500, with a far superior CAGR/Max Drawdown ratio, also known as the MAR ratio. The MAR ratio is the ultimate measure of a strategy, trader, or investor's performance. Moreover, the ride for an investor in this strategy is not very bumpy, with a Sharpe ratio which far exceeds that of the S&P 500.
I am always fascinated with the illogical obsession that the public has with investment bestsellers, the best of which present tired investment strategies which only outperform popular indices by 2 to 5 percentage points per year. These books are usually mechanized, warmed over versions of Benjamin Graham's original value-based investment strategies, which were totally revolutionary decades ago. And of course, Graham was a total genius, and many of his strategies continue to perform extremely well today. I just have a real problem with people taking leftovers from the master, putting them in the microwave to reheat them 70 years later, then calling it original cuisine, rather than blatant copying with very few new ideas.
The goal of my firm's intellectual property library of quant strategies and of our continuing R&D is to do wildly new things which no one has seen before. But no individual strategy is the product. The product is innovation itself. And I think we have accomplished that on many occasions, with the public version of long-biased Hedged Convexity Capture, even stripped of its advanced bells and whistles, outperforming the S&P 500 by 38 percentage points per year.
This does not mean that this massive outperformance will continue, but it does mean that the strategy is well worth further exploration. Interestingly enough though, long-biased Hedged Convexity Capture continues to dominate the SPY YTD by 15 percentage points, which is outstanding in a choppy market, and blows away the critics who thought the strategy could not withstand equity headwinds.
(click to enlarge)
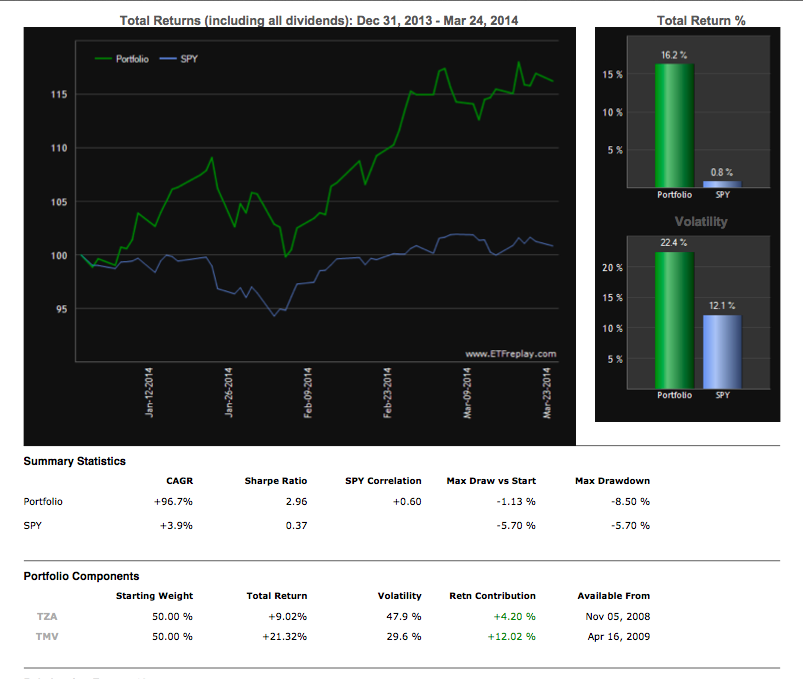
My personal view is that the strategy could underperform during strong bull markets, but will outperform during choppy and bear markets for equities. Of special interest is the high Sharpe, combined with a MAR ratio that far exceeds that of the SPY ETP over the same time period with only moderate correlations to the S&P 500.
However, even though the strategy tests well, I never rely on theory alone. The advanced non-public version of this strategy uses a systematic switch to enter and to exit the strategy to further reduce risk.
I believe the strategy's major risk, since it uses shorting, is a discontinuous drop in markets which causes the TZA leg of the trade to skyrocket far more than the TMV could drop.
As I often say, no strategy is even close to perfect. There are only strategies which are preferable to all other possible alternatives. We have created an advanced non-public version of the strategy for clients which does not use shorting. I think the public version presented here has the ability to stimulate thinking on the part of investors by clearly illustrating that even seemingly simple strategies using powerful mathematical principles can dramatically outperform strategies presented in popular bestsellers, while using fewer instruments with less hassle to implement.
Investors are constantly bombarded with intuitive strategies. And intuitive strategies may be excellent marketing vehicles, but they are often far worse performers than non-intuitive strategies. Strategies which rely upon an understanding of pure mathematics have a higher probability of sustained outperformance, because most people are not wired to feel emotionally comfortable with mathematical strategies.
It is this emotional discomfort which not only hinders the popular adoptions of such strategies, but also creates the potential for sustained outperformance for those unique investors who do appreciate their logic.
The bottom line for investors is that technology is evolving quickly. Professional traders like myself have invested heavily in cutting-edge R&Dwww.amazon.com/Youre-Welcome-Planet-Earth-Powerful-ebook/dp/B00DBT66MI/ref=la_B00DC7EPJK_1_1. We have objectively proven that the results of this R&D far exceed the performance of everything else publicly available up to this point. Therefore, the public should stop being impressed going forward with any method which does not have the ability to outperform equity indices by huge margins.

Tuesday, March 25, 2014

Market Timing Report: Negative Divergences Set The Stage For A Nasty Spill

Summary
  • In the stock market, there has historically been a pronounced correlation between what occurs in January and what happens for the remainder of that year.
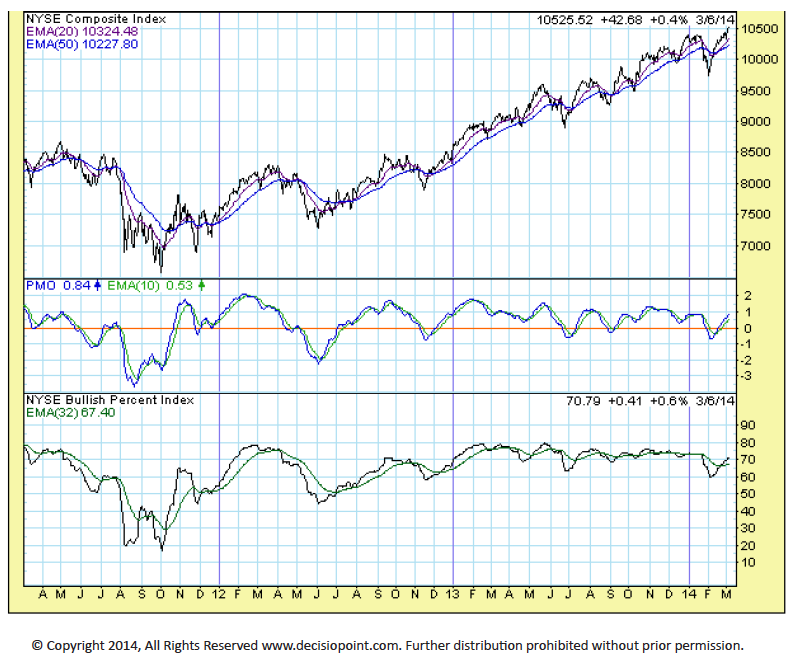
  • The January 2014 correction and subsequent rally have left some significant negative divergences and subsurface weakness, which the indexes are masking.
  • The “January Barometer” is firmly in place, insider selling is at alarmingly high levels and margin debt is being used in a reckless fashion.
  • Thus, we feel the stage has been set for a nasty spill in the stock market.
Editor's note: This report was initially released to the author's subscribers on 3/18/14. All references to specific dates should be read accordingly.

The January Barometer has been much debated over the years, yet the data clearly supports the fact that stock market performance in
the first month of the year predicts performance for the remainder of
that year. The charts to the right clearly illustrate what a strong
January leads to for the rest of that year versus what occurs when
a weak January has occurred. A data outlier occurs for 2009
(second chart). In 2009 we were just coming off the 2008 crash.
January 2009 was down 8%, yet yearly performance was actually
up 23%. This outlier does not negate the efficacy of the January
Barometer; entering another bear market would be highly unlikely
after having just experienced such a significant crash.

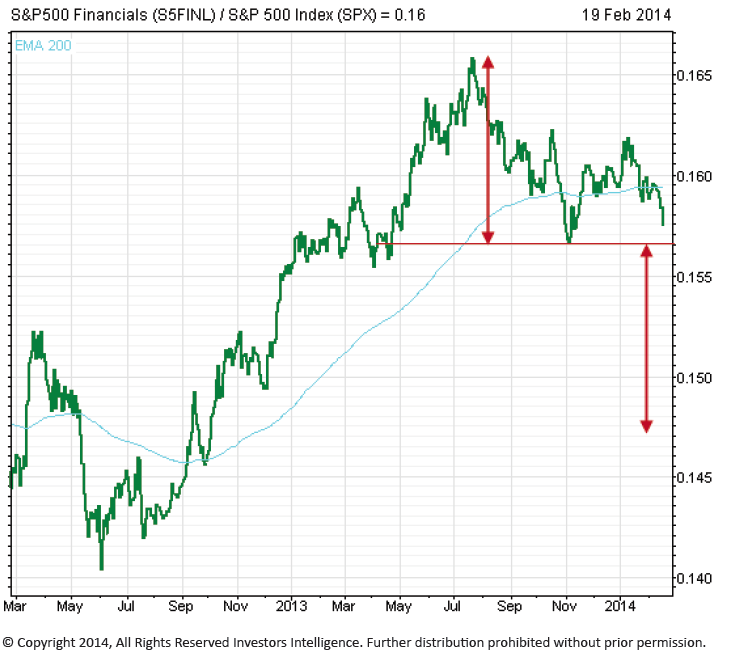
Until recently, the financials have participated in the general upswing in equities. However, over the last six months financials have begun to
underperform the stock market. This is a concern because when financial institutions begin to have difficulties, problems are exacerbated and spill over into the general economy.

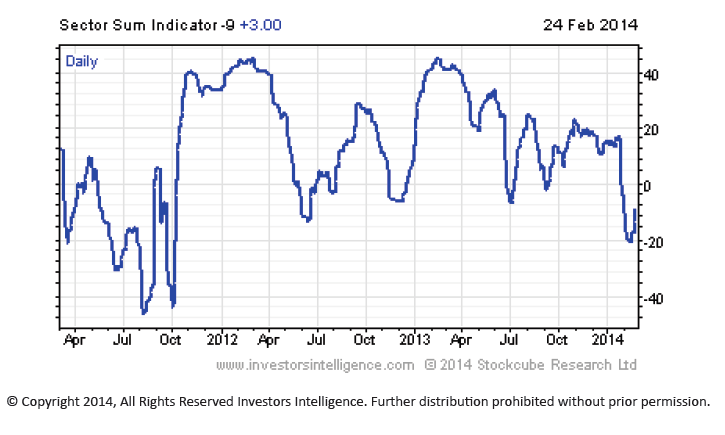
The Sector Sum Short- Term Status is determined by its chart direction in combination with the direction of the group’s cumulative advance decline line and the last three day’s direction on the NYSE bullish %. Not only has the Sector Sum been on a sell signal, but it has also been making a series of lower highs over the last 12 months. The indexes, in comparison, have been making higher highs. This shows that not all sectors are moving up higher with the market. Although the indexes have moved higher, the Sector Sum Indicator is showing subsurface
weakness and deterioration.

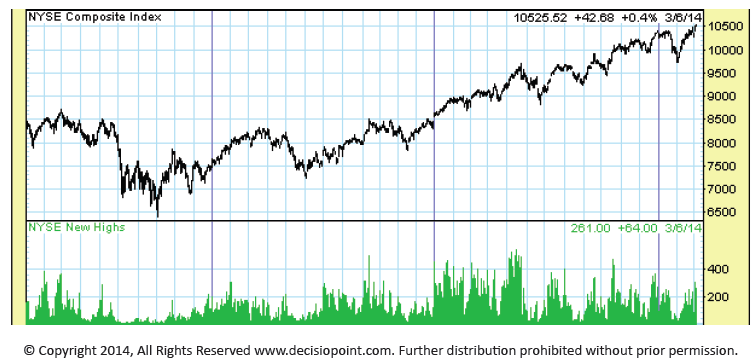
One can see in the chart below that although the indexes have been moving higher over the last six months, the number of 52-week highs has been in steady decline. This warning sign is a direct symptom of a narrowing tape.

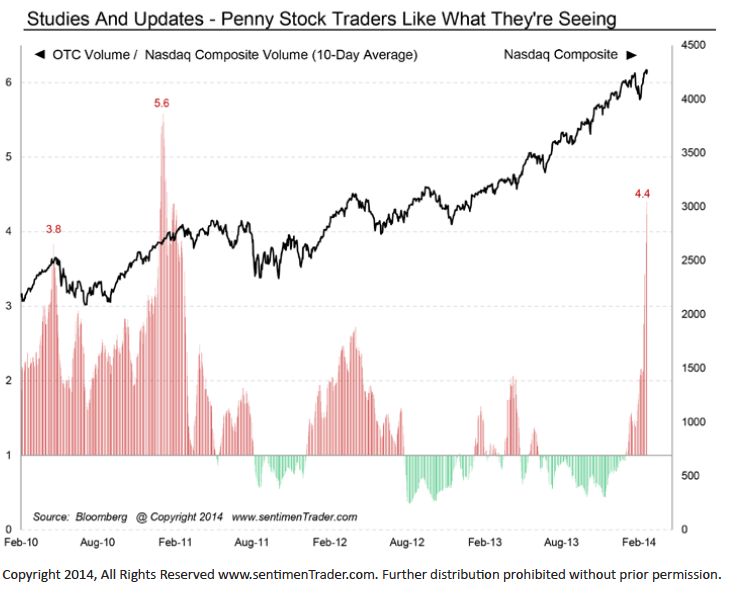
It is useful to gauge speculative fervor in the Over-the-Counter market. At this time we are noticing a significant spike in speculation. Since February 10th there has been increased volume in penny stocks relative to the NASDAQ Composite volume. This activity is a warning sign; traders are becoming extremely active in penny stocks, which are traditionally speculative in nature.

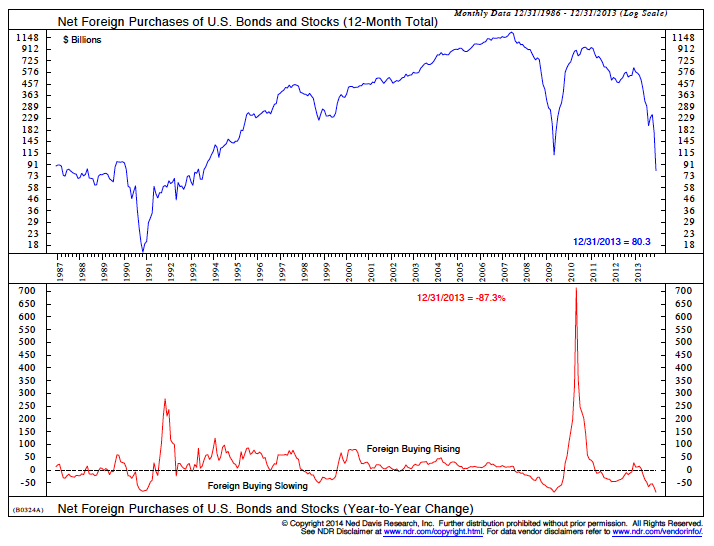
While corporations have been a steady buyer of stocks, foreigners have begun to sell US securities. In fact, their purchases have fallen to a 20-year low. This move downward encompasses both official institutions and private investors.

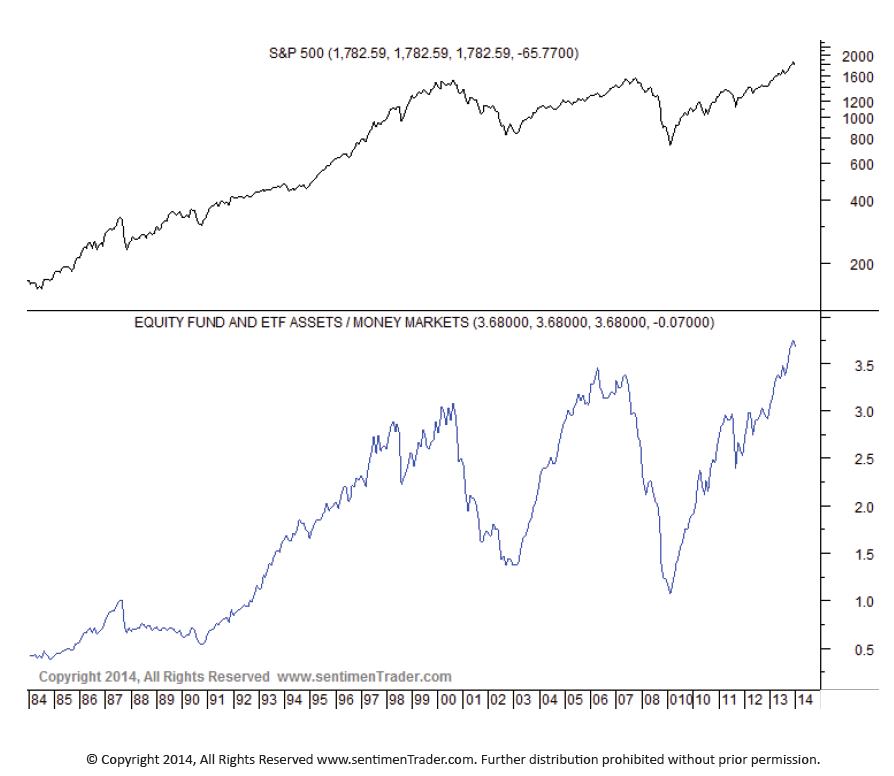
There is currently 3.68 times more money allocated to stocks than is
invested in money market funds. This is a 30-year high. The last two peaks occurred during the top of the last two markets of 2000 and 2007. While most believe there is plenty of cash on the sidelines, this
ratio indicates otherwise and is a significant intermediate term negative.

Sentiment

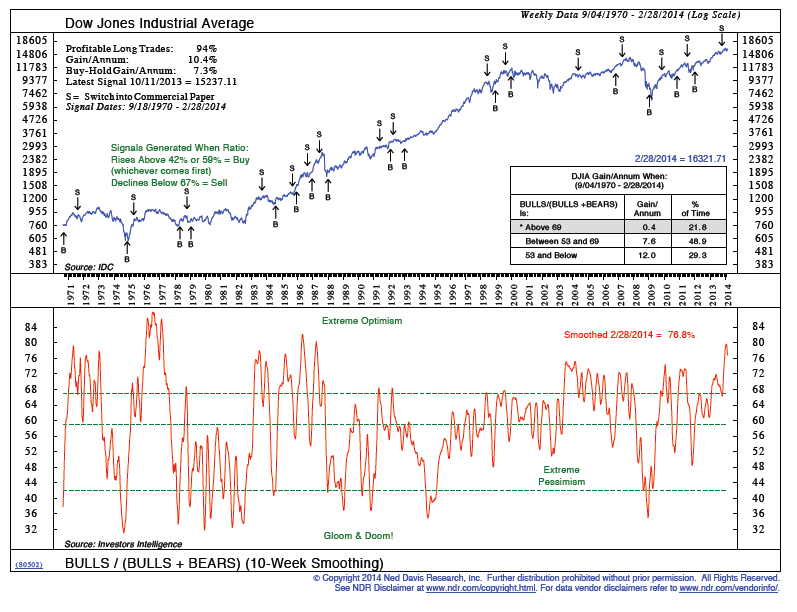
The Bulls/ (Bulls+Bears) sentiment gauge remains at a lofty level. The
current reading of 78 reflects an overoptimistic marketplace with high
expectations. Margin debt is also at an all-time peak, reinforcing our assertion that speculation is running high.

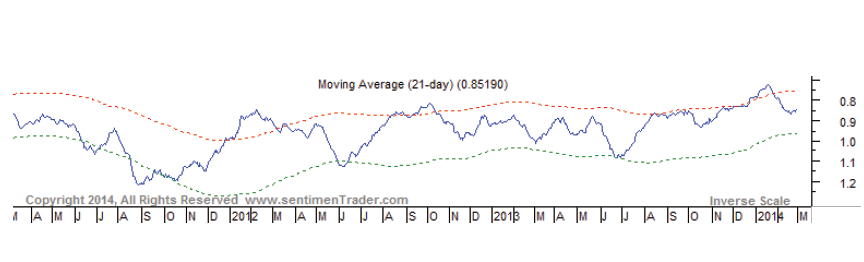
The CBOE 25-day Total PutCall ratio is designed to monitor monthly put versus call activity. It is used in a contrary fashion, meaning that when more puts are purchased it is a bullish sign and vice versa. The most recent reading of .83 shows that currently excessive call buying is taking place, which is extremely bearish.

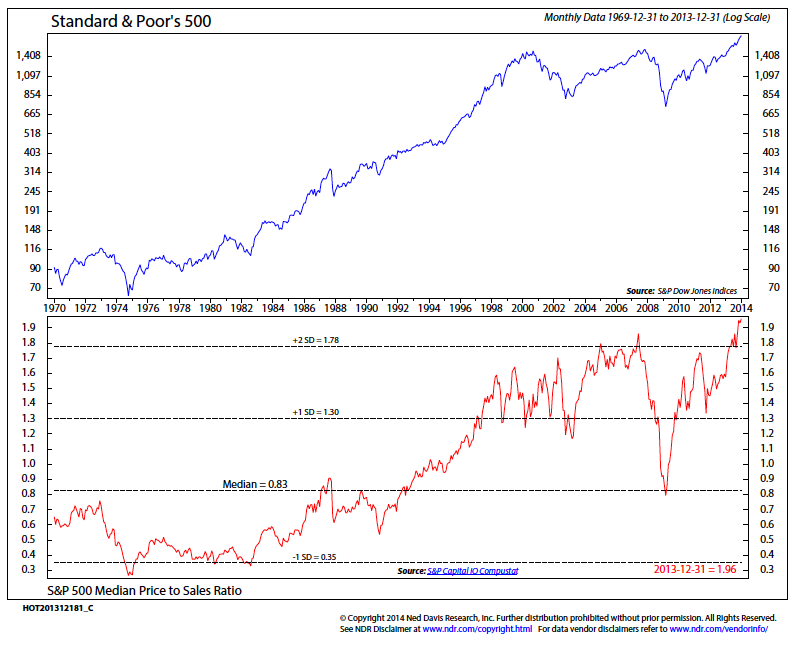
We’ve written about Price To Sales in previous issues of LMTR. This
indicator recently hit a 50-year high. Many fundamentalists assert that the stock market is “cheap”, but we do not believe that this is the case. Sales are extremely difficult to manipulate through earnings buybacks, and the current reading of two standard deviations from the mean is extremely bearish.

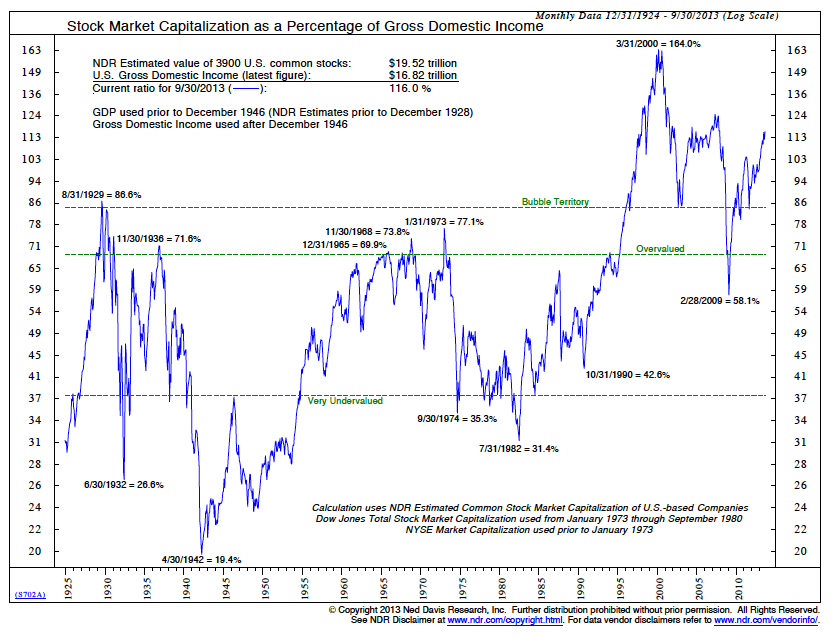
The primary concept expressed in this final chart is a comparison of stock market value relative to GDP. We are presently above 2007 levels and are fast approaching 2000 levels on this indicator. Such distortion typically occurs during periods when stocks are overvalued in comparison to the GDI.

Conclusion

The January correction and subsequent February rally have created some negative divergences. As the indexes continue to advance, more and more indicators and fewer and fewer stocks are participating in each upswing. Sentiment, margin debt and insider selling are all in red-hot sell zones. In fact, insider selling has accelerated 30% over the preceding period. Such negative readings lead us to maintain our 32% short position.
Disclaimer
Lamensdorf Market Timing Report is a publication intended to give analytical research to the investment community. Lamensdorf Market Timing Report is not rendering investment advice based on investment portfolios and is not registered as an investment advisor in any jurisdiction. Information included in this report is derived from many sources believed to be reliable but no representation is made that it is accurate or complete, or that errors, if discovered, will be corrected. The authors of this report have not audited the financial statements of the companies discussed and do not represent that they are serving as independent public accountants with respect to them. They have not audited the statements and therefore do not express an opinion on them. The authors have also not conducted a thorough review of the financial statements as defined by standards established by the AICPA.
This report is not intended, and shall not constitute, and nothing herein should be construed as, an offer to sell or a solicitation of an offer to buy any securities referred to in this report, or a “buy” or “sell” recommendation. Rather, this research is intended to identify issues portfolio managers should be aware of for them to assess their own opinion of positive or negative potential.

Friday, March 21, 2014

唯品会百亿美元市值是否存泡沫:自称服务人群忠诚度高

唯品会百亿美元市值是否存泡沫:自称服务人群忠诚度高

2014年03月19日 07:51  《中国企业家》杂志  我有话说(20人参与) 收藏本文     
【中国企业家网】一个曾经“流血上市”的公司,短短两年间股价上涨45倍,市值超过2个新浪,3个搜狐,7个当当。它在资本市场追捧下又能走多远?
  沈南鹏在看到本文之后,如此评价:这篇唯品会的文章写的不错,客观、有深度,厉害!这是我看到媒体写唯品会最好的一篇。
  资料图片
资料图片
文_本刊记者 邹玲编辑_袭祥德
  “高调的人死的很快,低调的人通常能活得久一点。”对面的中年男人,在经历了一场舆论风暴后,坐在了我的面前。他刚刚因为被媒体冠上“中概股之王”和“第一妖股”而大发脾气,“我在认真思考一个问题,”他看着我说,“从此我再也不接受媒体采访了。”
  2013年1月,本刊记者赴广州采访唯品会时,创始人沈亚声称这将是他最后一次接受媒体采访。2013年至今,他信守了“诺言”。但低调的同 时,唯品会在资本市场的表现却一发不可收。2014年3月,唯品会股价站上了170美元,市值超100亿美元,成为继腾讯、百度、奇虎360之后第四大市 值的互联网公司,以及电商圈中炙手可热的新贵。
  高股价对唯品会野心的刺激可想而知,“中国的电商已经结束了群雄争霸的年代,大局已定,而唯品会必将占据前三强中的一席。”3月6日,唯品会CFO杨东皓对《中国企业家》信誓旦旦地表示。
  作为一个偏安于华南一隅,远离电商漩涡的企业,唯品会在成立之初被嘲笑为清理库存的“下水道”,商业模式简单,页面设计“土气”,购物体验不 佳。但现实是,截至2013年第四季度,唯品会毛利为24.5%,同期当当为17.6%,京东为9.8%。在电商平台中几乎最高的毛利率造就了唯品会一路 高歌和疯涨45倍的“神话”。
  作为国内独家采访过唯品会创始人及高管的媒体,《中国企业家》见证了唯品会坐上“台风口”的历程,一家毫无背景的电商公司怎样从巨头林立的丛林中杀出一条血路?唯品会的高股价是资本市场的大泡沫还是选对了赛道的新长跑?时隔一年,唯品会又站上了风口浪尖。
  风口与泡沫
  沈亚算是电商中的异类。传统贸易行业出身的沈亚和另外一名合伙人洪晓波在通信器材外贸领域已浸淫10年,与马云、刘强东等互联网或者IT背景的 创业者不同,沈亚和洪晓波并不懂互联网(这一点在上市时也被投资人拿来诟病),从来不号称自己是“产品经理”,甚至连微博账号都没有。
  “我跟他们北京派的不一样。”沈亚解释道,“我是温州人,又在广州工作,广东派都比较务实一点。”
  采访中,沈亚多次表示,“其实我们跟他们做互联网的不一样,因为我不觉得只有互联网思维才能做好电商。”他又重重加上了一句,“在合适的时间做什么事情,我们现在要去做一个云计算中心,那不是疯掉了吗?”
  有趣的是,这个号称拒绝“互联网思维”的公司,在一年后站上了中国第四大市值互联网公司的座席。当然,这个坐席更像是一个火山口,唯品会自上市以来股价与市值就一直争议不断,当股价达到170美元、市值超过100亿美元后,市场对其市值“泡沫”的担忧进一步加剧了。
  作为一名忠实的美股投资者,许志宏很早就关注唯品会。他是美股投资论坛“雪球”上最早开始讨论唯品会的人。“唯品会给我的第一印象是团购界的hao123,扎根很深,非常了解中国普通用户,我认识3000到4000元收入的女孩子都在10点钟等着上新货。”
  许志宏发现,唯品会两大投资方之一DCM基金在中国投了一系列接地气的互联网项目,都是业务听起来毫不性感,股票却巨牛逼的,比如易车网、58同城等都是DCM在背后操盘。
  
  
  唯品会创始人之一洪晓波曾是一名体育健将
  正因如此,唯品会流血上市之初,许志宏非常看好。不过,随着唯品会股价飙升,与许多投资者一样,许志宏也开始怀疑“唯品会”的真实业绩是否能支 撑起高估值,他将唯品会与当当、Amazon等中美同类电商股比较,得出的结论是被“严重高估”,他甚至有了“做空”的冲动。让他惊奇的是,唯品会一直没 有给他做空的机会,反而一路上涨至170美元。
  派代网独立电商分析师李成东对《中国企业家》表示,对于估值的计算方法不同是造成分歧的重要原因。“美国的母婴闪购电商Zulily,2013 年营收才7亿美元,市值77.15亿美元,华尔街的分析师看电商主要看的是市销率P/S(普通股每股市价与每股销售收入的比率),而不是市盈率P/E(股 票市价与其每股收益的比值)。”李成东认为,唯品会第四季度财报净营收6.510亿美元,较上年同期增长117.3%,实现了首个盈利财年的目标,而同期 其它电商大多还在亏损。这一亮眼的业绩让华尔街对唯品会信心大增:相比于Zulily10倍的市销率,唯品会的净利润和营收更高,而不到6倍的市销率仍有 上涨空间。
  眼下,唯品会100亿美元市值的高位上,其“清库存”模式是否已经撞到了天花板成为市场质疑的另一个焦点。杨东皓向《中国企业家》解释说,关于 尾货市场的规模,外界普遍有一个认识误区,认为是经济大势不好,衰退经济周期导致大量库存,“但实际上,即使是在欧美成熟市场,也会有大概20%的销售额 来自于尾货。中国一年的服装规模是3300亿美元,20%就是4000多亿人民币(6.2250, -0.0025, -0.04%),我们2013年才做了100多亿,这里面是完全没有泡沫的。”
  尽管如此,唯品会目前股价是否合理仍然存在争论,在一些投资人士看来,它已经过度透支了未来两年的上涨动力,而且面临一个新窘境:电商巨头开始 跟它抢夺蛋糕,而唯品会现有的增速开始放缓,其2010年-2013年营收增速分别为1061%、597%、204%、145%,它急需新故事来为增长注 入动力。
  2014年,唯品会成立了“投资与并购”战略部,这个部门成立后的第一个动作便是拿下“乐蜂网”——2月14日,唯品会宣布战略入股东方风行旗下乐蜂网75%股份,这也是唯品会上市以来首次大的并购投资。
  “美妆的市场非常大,有1200亿,而2015年会发生一个最大的变化,电商将会超过家乐福、屈臣氏,成为美妆领域的第二大渠道。”唯品会副总裁冯佳路在解释二者的联姻动机时表示。
  互联网的消费主力是女性,沈亚所处的温州商人圈深知这一点,并且知道怎么从女性身上赚钱。唯品会早期的股东之一欧时力,一个温州起家的女装品牌 做到了估值20亿美元,吸引了LVMH集团的投资,“这样的人隐身在唯品会后面,决定了唯品会跟任何一个电商的基因都不一样。”专注于女性消费的尚道咨询 公司董事长张恒评价道。
  “唯品会崛起,受冲击最大的是天猫。”张恒对《中国企业家》说,原来一个品牌的互联网销售渠道70%是在天猫,而现在分流效应明显,天猫占比已经下降到了50%。另一方面,一直以来以男性消费为主的京东也在考虑向女性消费市场扩张。
  3月8日,一场争夺女性消费者的电商大战开启:“骗女生,后果很严重!”一向以3C家电品类为主的京东出人意料地投放了一系列以女性消费为主的 广告,主打“美妆”等品类;此时,乐蜂网的“桃花节”正如火如荼;淘宝更是请来了女人心目中的“长腿男神”李敏镐做代言。这一切背后,显示出电商意识到了 女性消费市场的巨大潜力。
  除了巨头环伺,唯品会还将面临电商格局的大洗牌。腾讯2.14亿美元入股京东已水落石出,而腾讯的B2C平台QQ网购、拍拍网将一并并入京东, 一旦京东跟腾讯结盟,电商格局将会被重新改写。对此,唯品会给出的应对是发力移动终端,3月中旬在微信的“精选商品”频道推出移动端的“限时抢购”。沈亚 在最近电话会议中透露,唯品会2013年第一季度移动端只占总销售的8%,2013年第四季度增长到23%,最近一个月增长到超过三分之一,而且未来将会 继续增长。
  逆互联网生存
  唯品会高股价的背后有没有“推手”?一个版本是,唯品会上市之初股价大幅下跌,沈亚撑不住了,就打电话给温州商会负责人求救。结果,在很短时间内,温州商人圈子就凑足了一笔钱替沈亚解了燃眉之急。
  
  不管这个版本真假如何,唯品会及沈亚背后的温州商圈确实是不可忽视的要素。资料显示,唯品会天使投资人均为浙江温州人,和创始人沈亚、洪晓波为长江商学院同学,其中两个分别为服装品牌法派集团老板彭星和国内女装品牌欧时力老板徐宇,无一人有互联网背景。
  一家没有互联网基因的公司究竟靠什么获得资本的追捧?关于唯品会,有一些鲜为人知的秘密,或许可以在一定程度上平抑外界的众多质疑。
  沈亚和洪晓波长期以来共用一间办公室,除副总级别采用全透明玻璃隔断独立办公室之外,基本采用全开放式,也没有明显的部门标识。除了这些透明化 的安排之外,很少能看到典型互联网公司的痕迹。而与传统互联网公司不一样的是,唯品会占地最大的是客服部门和拍摄间,IT部门只占据了小小的一个角落。
  沈亚从来不愿谈论IT界的时髦词汇,“大数据”、“云计算”等离他太远,“我们更多是一个传统的零售商。”沈亚对《中国企业家》承认,唯品会的技术在整个IT领域并不算强,“我们更懂商,而不是电。”
  唯品会有几个特殊之处容易被忽视。首先唯品会是一家“重公司”。京东主打3C等标准化高的产品,而唯品会则是标准化程度最低的服装鞋帽等百货类 商品。“我们跟京东的最大不同,就是京东不需要买手,没有专业门槛,而我们说白了就是要从卖不出去的东西里把好卖的挑出来,这个门槛有多高?”杨东皓表 示,唯品会有一支600余人的买手团队。买手多是源自于《瑞丽》、《昕薇》等美容和时尚媒体的编辑,对时尚敏感度高,这对于处理库存为主的特卖网站是第一 道门槛。
  甚至,唯品会庞大的线下客服团队也比一般电商公司要“重”。“京东几乎没有电话客服,而我们有一支300多人的呼叫中心。”沈亚对《中国企业家》表示,时尚类的消费者跟3C类百货很不一样,唯品会更像线上的奥特莱斯。
  电商圈对于唯品会的“买手制”运营模式一直存在争论。一名当当网员工对记者表示,“当亚马逊都在用长尾理论和大数据为顾客精准匹配需求的时候, 还有唯品会这么重的线下方式来做采购,实在是有违电商的本质。”而沈亚则认为唯品会以服装为主的品类决定了运营的方式,个性化品类的运营方式跟标准化品类 截然不同,同质化严重的商品反而很难做到高毛利。
  其次唯品会是唯一一家不设搜索的电商网站。在其它电商都大力改进用户的搜索体验,提高搜索的精准匹配度时,唯品会却是逆其道而行之,在满满的页面上居然不设置一个搜索框。只让用户根据唯品会设置的品牌链接来购买,这源于沈亚对女性生意的理解。
  张恒对《中国企业家》表示,在互联网上设置搜索,这是男性化的思维。女性思维是感性而碎片化的。“你看苏宁和京东都是文字为主,不像唯品会以大幅的图片,粉色和紫色的页面基调,刺激女性的消费。”
  沈亚不想进入电商行业惨烈的“比价”模式圈套,而是不断推出新品来刺激女性的“冲动消费”。在沈看来,大部分女性购买是没有目的性的,以逛为 主,唯品会吸引的是这种女性,如果一旦让她开始搜索,比价,思考了,那就没有感性消费了。这也是为什么唯品会的重复购买率是电商行业中最高的,达到了 70%,正是这70%的回头客贡献了90.6%的订单量。
  “唯品会在运营思路上是很接近小米的,只服务特定的一个人群,忠诚度高,而且会重复购买。”唯品会的一名供应商对唯品会的库存消化能力非常惊 叹,据他介绍,唯品会对于品牌的运营能力首屈一指。“比如考察一个品牌是否要在唯品会上销售,它的一个衡量指标是在线下有至少200家门店。”该供应商告 诉记者,唯品会上销售最好的并非国外大牌,而是二三线城市店面较多的本土品牌。沈亚非常了解非一线城市顾客的需求,名字听说过,加上够便宜,这两点就能在 线上卖的好。
借助这一系列看似“逆互联网思维”的举动,唯品会攫取了大量三四线城市女性消费者的芳心。“她们大多月薪在2000到8000元,对款式没这么敏感,更 注重品牌和性价比。”杨东皓对《中国企业家》这样描述唯品会的主要目标群体。据杨东皓透露,唯品会在一线城市的订单仅仅占到13%左右,而二线省会城市占 据了30%,甚至四线城市和县乡都占比超过了20%。这一点也从唯品会物流总监唐倚智的采访中得到了印证,“我们内蒙古和贵州省的订单都进入了排名前十的 省份。”
  这在一定程度上解释了唯品会“两极分化”的表现:在股价和业绩一路狂飙突进时,你却可能连这个网站的名字都没听说过,也很少看到周围有人在上这个网站。
  假如唯品会能如杨东皓所说,将目标定位电商三强中的一席,“京东跟唯品会未来必有一战”,电商资深从业人士龚文祥对《中国企业家》表示,唯品会在私下只将京东视为“最主要的竞争对手”,而这次三八节的营销战将为它们扳动第一声枪响。
  “按照电商三分天下的格局,唯品会现在100亿美金的估值还相当便宜。”杨东皓对《中国企业家》表示。而另外一个曾经的竞争对手凡客,在上市的黎明前功亏一篑,如今境况判若两人。
  这也正是外界对唯品会担忧所在——是否会成为另一个泡沫。

Tuesday, March 18, 2014

Why Intercept Pharmaceuticals Inc. Shares Tumbled

Why Intercept Pharmaceuticals Inc. Shares Tumbled

Intercept shares endure a rough day after releasing earnings, updating its FLINT trial results, and announcing its POISE trial results.
Although we don't believe in timing the market or panicking over market movements, we do like to keep an eye on big changes -- just in case they're material to our investing thesis.
What: Shares of Intercept Pharmaceuticals (NASDAQ: ICPT), a clinical-stage biopharmaceutical company developing therapies to treat chronic liver and intestinal diseases, fell as much as 16% following a myriad of weekend data including its quarterly results, the release of phase 3 results utilizing obeticholic acid, or OCA, to treat primary biliary cirrhosis of the liver, and updated adverse event data from its phase 2 study of OCA in treating nonalcoholic steatohepatitis, or NASH.
So what: First, Intercept delivered its quarterly results which resulted in $405,000 in licensing revenue and a net loss of $12.4 million which was considerably lower than the $30.8 million loss reported in Q4 2012. Intercept announced that it ended the quarter with $144.8 million in cash and cash equivalents and likely has enough cash to fund its operations into the third quarter of 2015.
The bigger movers though were its phase 3 study results and phase 2 update. Its phase 3 POISE trial delivered solid results with OCA hitting its primary endpoint of achieving a serum alkaline phosphatase reduction equal to 15% from baseline as well as normal bilirubin after one year of therapy. Relative to the placebo, 47% of the 10 mg OCA cohort and 46% of the 5-10 mg cohort met the primary endpoint compared to just 10% of the control arm. OCA also offered a similar and favorable safety profile to the placebo. Based on this data Intercept will shortly be filing for a new drug application for OCA in treating primary biliary cirrhosis.
What really has investors' concerned, though, are two paragraphs on page 14 of its 10-K annual filing. According to the National Institute of Diabetes and Digestive and Kidney Diseases which released additional data on the FLINT trial for NASH to Intercept, there were 10 cardiovascular serious adverse events that occurred in seven patients (2.5% of total patients) across both NASH treatments groups. We already know that the independent data safety monitoring board expressed concerns previously about elevated lipid levels in the liver since this can be a factor which can lead to a serious cardiac event, among other issues. However, based on the 10-K, the NIDDK, "has advised us that while the incidence of the serious cardiovascular events was numerically higher in the patients receiving OCA therapy, it was not statistically significantly different as compared to the placebo group." Eight patients were deemed to have adverse events not related or probably not related to OCA while two additional patients in an unblinded group were considered to have their events possibly related to OCA. Full FLINT trial data will be released in July.
Now what: That's an absolute mound of data to take in during a single day and is a reason why I'm not shocked that Intercept's share price was all over the map today. What's really important here is that OCA looks great as a potential new therapy for primary bilary cirrhosis, and the concerns about increased lipid levels in its NASH trial appear to be statistically insignificant relative to the placebo group. While I would urge investors to be cautious given that with Intercept's share price has risen so much already, this update would suggest that OCA remains on track to possibly become a blockbuster therapy.
Intercept share have skyrocketed over the past year, but even it may struggle to keep up with this top stock in 2014
There's a huge difference between a good stock and a stock that can make you rich. The Motley Fool's chief investment officer has selected his No. 1 stock for 2014, and it's one of those stocks that could make you rich. You can find out which stock it is in the special free report "The Motley Fool's Top Stock for 2014." Just click here to access the report and find out the name of this under-the-radar company.
Sean Williams has no material interest in any companies mentioned in this article. You can follow him on CAPS under the screen name TMFUltraLong, track every pick he makes under the screen name TrackUltraLong, and check him out on Twitter, where he goes by the handle @TMFUltraLong.
The Motley Fool has no position in any companies mentioned in this article. Try any of our Foolish newsletter services free for 30 days. We Fools don't all hold the same opinions, but we all believe that considering a diverse range of insights makes us better investors. The Motley Fool has a disclosure policy.

Saturday, March 15, 2014

Monitoring Your Health With Mobile Devices

Monitoring Your Health With Mobile Devices

A medical camera from Firefly Global shows a child's eardrum on a screen.
Dr. Eric Topol is only half joking when he says the smartphone is the future of medicine — because most of his patients already seem “surgically connected” to one.
A blood glucose monitor from AgaMatrix works with an iPhone app.
A blood pressure cuff from Withings works with an iPhone or iPad to track blood pressure over time and can send the data to a Web site.
But he says in all seriousness that the smartphone will be a sensor that will help people take better control of their health by tracking it with increasing precision. His book, “The Creative Destruction of Medicine,” lays out his vision for how people will start running common medical tests, skipping office visits and sharing their data with people other than their physicians.
Dr. Topol, a cardiologist and director of Scripps Translational Science Institute in La Jolla, Calif., is already seeing signs of this as companies find ways to hook medical devices to the computing power of smartphones. Devices to measure blood pressure, monitor blood sugar, hear heartbeats and chart heart activity are already in the hands of patients. More are coming.
He acknowledges that some doctors are skeptical of these devices. “Of course, the medical profession doesn’t like D.I.Y. anything,” he said. “There are some really progressive digital doctors who are recognizing the opportunities here for better care and prevention, but most are resistant to change.”
Dr. Topol may be right about the caution in the industry, but he is far from the only person with this vision. Apple was promoting the iPhone as a platform for medical devices in 2009. An entire marketplace is evolving that marries the can-do attitude of hacking devices with the fervor of the wellness movement.
Smartphones make taking care of yourself more of a game, Dr. Topol said. “I recommend these devices because it makes it more fun and I get more readings than if I ask them to do it manually.”
The enthusiasm for this vision of do-it-yourself medicine with a smartphone, though, must be balanced with the cold reality that all of the experimenters should consult with their physicians.
Some of the attempts to turn the iPhone into a medical device are little more than toys. The 99-cent iStethoscope Pro app warns, “This app is intended to be used for entertainment purposes.” Those who have bought it have given it uniformly poor reviews.
The equally poorly reviewed iStethoscope Expert 2012, also 99 cents, offers a $24 bell to enhance the sound.
I experimented with a homemade otoscope, the device doctors use to look into the ears, connected to a smartphone so I could take pictures of a family member’s eardrums. My son has had infections in his Eustachian tube and the doctor likes to take a look. I figured that if I could take a picture or a video of the eardrum, I could save the trouble of him missing school to visit the doctor.
With the help of a little duct tape, I attached the phone to a small home otoscope from a company called Dr. Mom Otoscopes. It is just a lens, a light source and a plastic sleeve and sells for $27. To improve the image, I inserted a $20 close-up lens I had bought fromPhotojojo.com.
The biggest problem was in the software of the smartphone. The Apple camera app balanced the light and dark over the entire image, washing out the center so the eardrum was just a sea of white. The Android camera app offered the option of using spot metering so the light balance was better.
Despite all this fiddling with the optics and the software, the result was never very good. Better results require more than duct tape.
Firefly Global in Belmont, Mass., makes a medical camera and sells it directly to doctors who want to share the images with patients and save them for the future. Its line includes cameras for dentists, dermatologists and ophthalmologists. Unfortunately, the $180 to $350 cameras connect to a computer, not a smartphone.
The most prevalent diseases and the biggest markets are getting the tools first. Devices to monitor heart disease are already available.
A French start-up, Withings, has created a blood pressure cuff for $129 that connects to aniPad or an iPhone. The cuff will automatically inflate, deflate and then record the pulse rate and the blood pressure. The app will graph the pressure over time, making trends easier to see.
Withings also includes a connection to its Web site so users can share their data with their doctors either directly through their password-protected pages or through third-party sites like digifit.com.
The growing incidence of diabetes is by many estimates the biggest public health challenge today, so companies are developing tools to help people with the disease manage their blood sugar.
Tom Xu, the founder of SkyHealth in El Cerrito, Calif., created the Web siteglucosebuddy.com to help people keep track of the sugar in their blood. The numbers must be entered manually. The site works with an app for the iPhone to gather the blood glucose level and some information about when it was taken. “Our main goal of glucosebuddy is not to just record numbers. That’s the boring part,” he said. “Once you know how your diet affects your blood sugar, you take your health more seriously.”
Other companies are beginning to integrate the hardware and software. AgaMatrix, a company that makes a blood glucose monitor, iBGStar, that attaches to the iPhone, worked with Sanofi, the pharmaceutical giant, to develop the tool. In December, the Food and Drug Administration approved the device for sale in the United States.
“When patients are dealing with chronic conditions, you might see a doctor every six weeks or two months,“ said Joseph Flaherty, the senior vice president for marketing at AgaMatrix. “For people to have real command over these diseases, we need to close the feedback loop and give people the information they need to make smarter decisions in real time.“
Its tool, like many other pocket meters, measures the amount of glucose in the blood, but it also transfers the data to the smartphone, which helps patients to track their glucose levels over time. It is not much different from a piece of paper and a pen, but it is faster and cleaner, and it is easy to share these values with doctors and friends.
Johnson & Johnson has also spoken publicly about developing a similar device. The ultimate goal is replicating the full-body diagnostic “tricorder” from the “Star Trek” TV show, a goal that is being encouraged by a $10 million prize put up by Qualcomm, the smartphone chip maker, through the X-Prize Foundation.
Apps that simulate the lights and sound of the TV show prop are available from app stores.

Thursday, March 13, 2014

YY Is Undervalued

Summary
  • YY reported earnings and revenue that easily beat analyst estimates.
  • Online music/entertainment continues to be the strongest growth contributor.
  • Gross margin expanded 260 basis points over Q4 2012, but is expected to be flat in 2014 on increased investments.
  • YY is undervalued compared to its high growth peers and has 50% upside based on the previously established price target of $126.
YY Inc. (YY) reported Q4 earnings and revenue that blew past analyst estimates. The company also guided Q1 2014 revenue ahead of consensus. The company is on track to deliver another year of strong growth as it builds on its success in online music, entertainment and gaming. While the company enjoyed strong margin expansion in 2013, management said that 2014 is going to be a year of increased investments. YY plans to invest RMB1 billion (approximately $160 million) in online education, an important new vertical that will boost the company's growth in 2015 and beyond.
Q4 highlights
YY's Q4 revenue increased 136% to $101.1 million, $18.1 million ahead of analyst estimates. Earnings per share increased 233% to $0.60 and was $0.15 higher than consensus. Most of the strength can be attributed to the online music/entertainment segment. The segment's revenue increased 49% sequentially and 217% Y/Y to $55.6 million. Paid users increased 17% Q/Q to 902,000, while the average revenue per user rose 26% to RMB373. The company managed to boost growth through series of group entertainment events and activities, like the popular 2013 Annual Entertainment Awards ceremony, which drove higher user engagement and spending.
Online game revenue rose 6% sequentially and 66% Y/Y to $26.9 million. What is concerning here is that paid users fell by 10,000 over Q3 to 433,000, but the ARPU rose 8% to RMB376. Games operated by YY rose by 15 to 126.
Online advertising fell 3% Q/Q and rose 29% Y/Y to $7.2 million. This sequential fall could be attributed to a rollout of very low-priced products in Q4, which diluted the unit price and increased the number of advertisers for the business. Management indicated that this is not going to be a trend in the future, and this is intended to be a one-time product redesign issue.
Flat margin in 2014
YY's gross margin rose 250 basis points Q/Q and 360 basis points Y/Y to 51.5%. Management indicated that gross margin will likely be flat in 2014, because the company will invest aggressively this year. RMB1 billion is to be invested in the education segment over the next couple of years. The company has built a strong foundation for its online education offering, and has recently launched an education platform called 100 Education. Education and mobile monetization will be the two most important segments to look at in the future.
Since the music segment is growing the fastest, and its revenue becomes a larger part of the overall revenue, it might impact the gross margin. YY shares approximately 40% of the total music business revenue with singers and channel owners. As this business becomes larger, it brings the gross margin slightly lower. However, we should not be concerned with the short-term impact of investments on YY's profitability, since the company's business model creates significant operating leverage. We should see profit margin improvement in 2015 and beyond, as the education segment scales significantly.
YY is undervalued compared to its peers, price target remains $126
YY trades at a significant discount over its high growth peers. When compared to Qihoo 360 (QIHU), 58.com (WUBA), Sungy Mobile (GOMO) and 500.com (WBAI), YY is trading at a significant discount. What is in common for all of the mentioned companies is that they are delivering high earnings and revenue growth, and are benefiting from strong growth trends in China's internet population and the increasing usage of smartphones. Every field these companies are involved with is growing significantly. 58.com is often called the "Craigslist of China", and has recently released its first earnings report since going public, which showed strong earnings and revenue growth, and guided ahead of analyst estimates. Qihoo and 500.com also reported earnings and revenue ahead of estimates, while Sungy Mobile is yet to report its first earnings since going public in November 2013. Sungy Mobile is benefiting from strong mobile growth trends, and has 87 million active users.

Source: Yahoo! Finance
In my previous article on 500.com, I stated that YY remains my top China internet play candidate. While I am maintaining my previous price target of $126, which translates into 50% upside from the current price, YY should also outperform its peers until its valuation comes closer to theirs. This also implies upside of 40% to 50%. If YY and its peers fall from here, YY should be the least affected stock given its lower valuation.
Conclusion
YY continues to execute its growth strategy very well. The company is on track to deliver another year of strong growth. Although the gross margin is expected to be flat in 2014 on increased investments, the company's operating leverage model will kick into higher gear in 2015, as the company scales its education segment. YY is currently undervalued compared to its peers, and has 40% to 50% upside to my price target of $126.

Monday, March 10, 2014

My Money Is On Elon Musk

Summary
  • Solar City is Elon Musk's other company.
  • I love a recurring revenue model like Solar City.
  • Why I own Tesla and Solar City.
My Money is on Elon Musk
I was recently asked by one of my radio listeners about my opinion of investing in Carl Icahn through his Icahn Enterprises (IEP). My reply was, you can invest in Icahn or a real innovator like Elon Musk.
I recently published an article on Tesla (TSLA), the shiny red stock that Mr. Musk is behind. I have a five year target price on that stock of $465. To see how I arrive at that seemingly outrageous number, click here.
Today, I want to feature one of Elon's other ventures.
SolarCity Corporation (SCTY) was founded in 2006 and is based in San Mateo, California. It has only been trading publicly however, since December 2012. The company is engaged in the design, installation and sale or lease of solar energy systems to residential and commercial customers and government entities in 14 states.
SolarCity's CEO Lyndon Rive, is famed serial entrepreneur Elon Musk's cousin. Elon Musk, the CEO and Chairman of Tesla Motors and the founder and CEO of SpaceX, is also the Chairman of SolarCity and actively involved with the company. This linkage is particularly significant given the potential business synergies between SolarCity and Tesla Motors.
SolarCity offers investors an attractive way to invest in the growing solar industry. Since the company does not manufacture its own solar panels, its financial results are not negatively impacted by declining solar panel prices and margin pressure.
SolarCity sells solar panel systems to residential and commercial customers, but the bulk of its business comes from the leasing side. SolarCity will generally install a system for free in exchange for a 20-year lease contract. I love recurring revenue models.
Leasing Model
The leasing model creates upfront costs for SolarCity in the short-term, but creates a reliable future income stream as the number of solar installations continues to increase. From the customer perspective, there is no upfront cost of installation, which facilitates a simple switch to solar.
Instead of paying their utility company monthly, the customer pays their solar lease bill which is typically lower. The customer receives clean, more affordable energy. The lease contract is also transferable upon moving. A win-win for all involved.
The value proposition from SolarCity's perspective is that they have a consistent, predictable stream of 20-year cash flows. The economics also improve from decreasing cost of capital and all-in installation costs as well as higher utility rates. SolarCity also has the opportunity to upsell other energy services to its customer base.
Solar Industry Growth
In the period from 2010 to 2012, the solar industry saw the pace of installations grow 670%. 2013 marked the first year that U.S. installations surpassed the world leader, Germany, with more than 400,000 individual solar projects installed last year. Fueling much of this growth is backlash over net metering, government incentives and tax credits, and reduction of cost and connection obstacles.
The state of California more than doubled its rooftop installations in 2013 from 1000 to 2000 MW. To put the significance of this number in perspective, it took California over 30 years to build its first 1000 MW of rooftop solar, and it just doubled it in one year.
Gaining Market Share and Scale
SolarCity's competitive leasing model is helping the company gain market share. The company's share of the market has risen to 32% from 19% a year ago. Given the fragmented nature of the solar installation business, SolarCity's 32% market share was the equivalent of the next 14 competitors combined.
Source: SolarCity Investor Relations
SolarCity deployed 280 MW (megawatts) of capacity in 2013, which exceeded the company's initial guidance of 250 MW. Total MW deployed was up 116% year over year, driven by strong residential growth of 130% year over year. The company expects 475-525 MW to be deployed in 2014, which would represent an increase of almost 80%.
Due to the long-term nature of the company's lease contracts, company management relies on specific metrics to gauge new sales activity and its business outlook. Operating highlights from 4Q2013 include:
  • Estimated Nominal Contracted Payments Remaining increased to almost $2 billion at December 31, 2013, up 79% year-over-year and 15% since the end of the third quarter of 2013.
  • Retained Value forecast increased to $1.05 billion at December 31, 2013, equating to retained value per watt forecast of $1.51/W at December 31, 2013.
  • Undeployed Tax Equity Financing Capacity of 171 MW as of February 21, 2014.
The company's cash flow turned positive in 4Q 2013, and the company's guidance was that it would remain cash flow positive in 2014. Economies of scale have been driving down cost per watt as volumes track ahead of target. In 2013, the company reduced cost per watt by 30%. Project cycle times have also been coming down, which equates to fewer labor hours spent during installation.
Source: SolarCity Investor Relations
Sales Strategy
SolarCity employs a diversified sales strategy in order to drive new customer growth. Its sales strategy uses a combination of direct sales (phone, internet/email, radio, direct mail, door-to-door) customer referrals and partner referrals. SolarCity's extensive network of referral partners includes homebuilders Pulte (PHM), Shea, and Taylor Morrison (TMHC); retailer Home Depot (HD); and auto companies Tesla and Honda (HMC).
DemandLogic and the Tesla Gigafactory
Elon Musk views SolarCity's and Tesla's businesses as interconnected. Last December, SolarCity announced a new program called DemandLogic that would provide large batteries to businesses to help them lower peak demand rates. The program couples solar panel installation with refrigerator-sized batteries that store up to a third of the solar power. Specialized software can then be programmed to take advantage of that stored electricity during times of peak demand.
Next comes the Tesla Gigafactory, an enormous battery manufacturing facility which will produce lower cost batteries. Lower cost batteries increase the value proposition of SolarCity's DemandLogic offering and give it a competitive advantage. Basically, any battery product breakthroughs that Tesla achieves will be shared with SolarCity.
Summary and Risk Analysis
Given SolarCity's strong industry growth prospects, leveraged business model, economies of scale, and synergistic ties to Tesla Motors, it is no wonder that SolarCity's stock has risen more than 960% since its $8 share IPO price. One criticism of SolarCity's business model is its high upfront cost of capital. The company must continue to finance its installations at a rapid pace. As a result, the company has had to develop innovative ways to finance this growth.
In November, the company priced its first securitized solar offering. The $54.4 million offering will be backed by cash flow from a pool of solar systems and pay investors 4.8% annually, maturing in 2026. This innovative financing method opens up a new financing option for SolarCity and others in the industry. In January, the company also opened itself up to crowd fundingas another means to fund future growth. SolarCity's need for financial innovation highlights a potential risk to its business model should capital become scarce or interest rates markedly increase.
Another risk is the potential for heightened price competition which could threaten profit margins. Until recently, SolarCity and Vivent had been the only two residential solar installers that were vertically integrated: owning origination, installation, and financing. But early in February, solar leasing company Sunrun acquired three residential solar businesses. Given SolarCity's rapid market share growth, there is likely to be more industry consolidation leading to increased competition in the coming year.
Finally, an additional concern that was highlighted recently is the company's complicated accounting structure. SolarCity's fourth quarter results were delayed as a result of the accounting related to recent acquisitions and a change of overhead allocated owing to an increase in the volume of MW deployed. Their earnings results have been delayed again and are now scheduled to be reported after the close on March 18.
Best Stocks Now Analysis
Gunderson Capital Management recently initiated a position in SolarCity on 2/25/14.
The stock is a mid-capitalization stock suitable for aggressive investors given its higher risk profile. It trades at a premium valuation of almost 48X annual sales and a price-to-book of 22.4. It has annual revenue of $142 million.