While I have been writing about momentum strategies on Seeking Alpha for over a year, I could not have picked a better time to transform this research into a monthly series than January 2013. As I noted in my article on Friday on momentum strategies within the fixed income universe, all four of the strategies highlighted in that article correctly picked the leg of the trade that would outperform in January. That trend extended to my article on fixed income/equity momentum strategies, as each of the equity asset classes that outperformed in December continued this relative outperformance in January.
The purpose of this series of articles is to demonstrate the success of these strategies, and give Seeking Alpha readers with differing risk tolerances tips on how to employ these strategies themselves to improve the performance of their balanced portfolio. These are useful strategies for Seeking Alpha readers, especially those who allocate dollars to their investment plan on a subscription basis, like 401k investors making automatic payroll deductions. These switching strategies can be used to adjust periodic allocations to capture the momentum effect and improve portfolio returns, especially in tax-deferred accounts.
Treasuries/S&P 500
The most basic momentum strategy involving the equity and fixed income markets is between the benchmark Treasury index and the S&P 500 (SPY). The monthly strategy switches between the two asset classes, owning the asset class that performed the best in the trailing one month forward for the next one month.
In difficult market environments, Treasury bonds typically rise in value as a flight-to-quality instrument while risky assets sell off. In improving economic environments, the opposite is usually true as equities rally and bonds sell-off as investors reap the returns of equity ownership and Treasury bonds are negatively impacted by rising inflationary impacts.
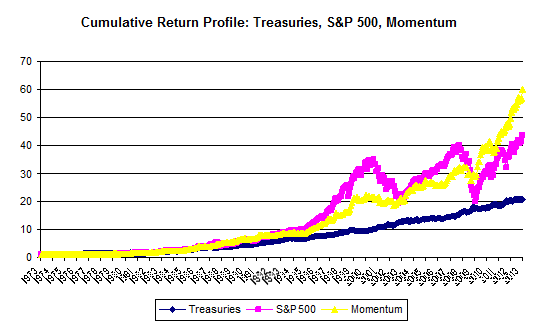
Below is a graph of the historical performance of the S&P 500, the Barclays Capital Treasury Index (GOVT), and a momentum strategy that buys the asset class that had outperformed in the trailing one month.
(click to enlarge)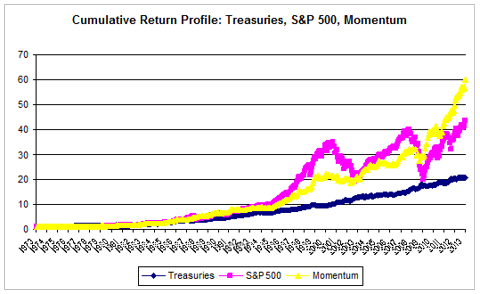
(click to enlarge)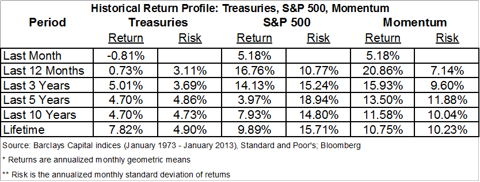

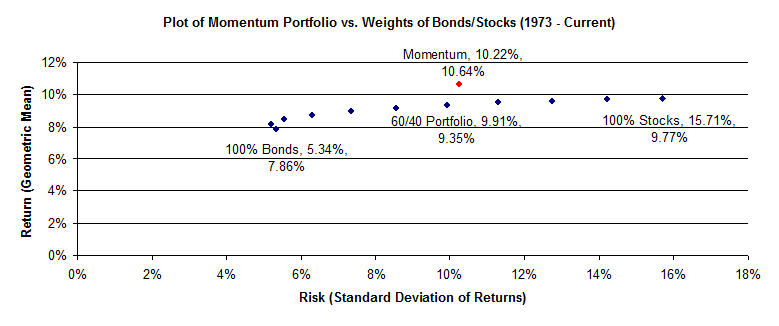
The results above should prove interesting to any Seeking Alpha reader trying to balance their allocation between stocks and bonds. Since 1973, when the Barclays Treasury index was first published, the momentum strategy has generated 86bps of annual outperformance versus the S&P 500 while only exhibiting roughly 2/3 of the volatility. Below is a graph of the risk/return profile of buy-and-hold portfolios of stocks and bonds versus this momentum portfolio historically.
This switching strategy would have allocated to stocks just over 55% (266/480 months) of the time from 1973-2012. Instead of allocating funds in a traditional 60% stocks/40% bonds balanced portfolio, allocating to the asset class that had outperformed in the trailing one month would have seen less dollars flow to equities, but roughly 130bps of average annual excess returns. Using the momentum approach to allocate funds, investors would have actually put less money into stocks over that forty year period than investors using a 60%/40% stocks/bonds split. However, the momentum approach would have produced meaningful incremental returns with lower volatility.
(click to enlarge)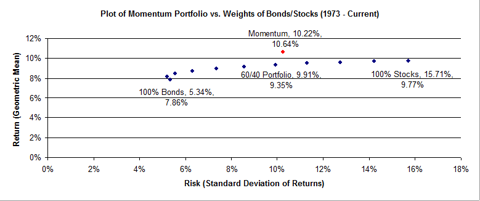
(For a mathematical look at why Treasuries were chosen as the fixed income asset class in these equity/fixed income momentum strategies see my inaugural article on these strategies.)
Readers wishing to implement this S&P 500/Treasury switching strategy in their own portfolio would have owned the S&P 500 in January 2013 given the outperformance versus Treasuries (S&P 500 0.91% vs. Treasuries -0.44%) in December 2012. Subscribers to this momentum theory (and articles) would have been well rewarded in January 2013 as the S&P 500 outperformed Treasuries by nearly 6% (5.18% vs. -0.81%). The outperformance of the S&P 500 in January suggests that investors should want to own the S&P 500 versus Treasuries in February.
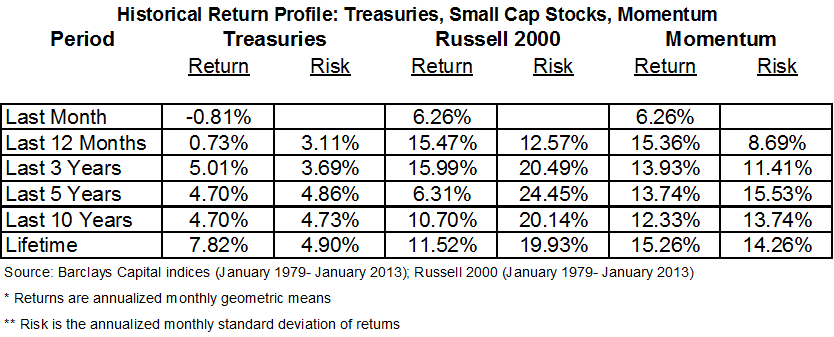
Treasury Bonds/Small-Cap Domestic Stocks
The efficacy of these momentum strategies is driven by the low correlation between Treasuries and stocks as the two asset classes perform well in differing market environments. These strategies suggest that the market is slow to adjust to new information, allowing for outsized returns by following the trade that has been outperforming in short trailing periods (and maybe more importantly avoiding stocks when markets are falling). It stands to reason that an asset class with an even lower correlation with the Treasury market historically, and higher long-run expected returns should produce a momentum strategy profile that fares even better than the aforementioned S&P 500/Treasury switching strategy. This is exactly what we find when small cap domestic stocks are incorporated.
(click to enlarge)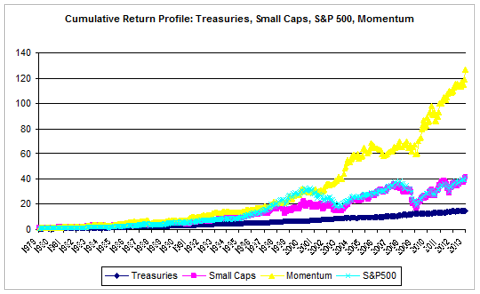
(click to enlarge)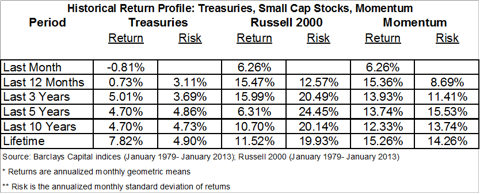
*Data correction from last month to include the total return version of the small cap dataset.
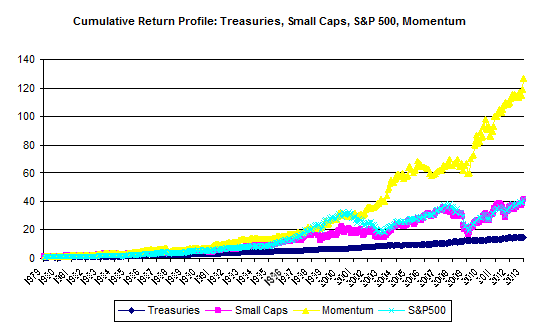
From 1979-2012, investors who employed a monthly switching strategy between small cap stocks (Russell 2000 ETF: IWM) and Treasury bonds would have cumulatively ended the period with nearly three times as much money as those who bought and held the S&P 500. Over that time period, the switching strategy between small caps would have also had slightly less variability of returns than owning the broad equity market index outright. The Treasury index and Russell 2000 had slightly negative correlation between their return profiles over this time period (r= -0.01). Readers should take note that the Treasury/small cap switching strategy is a souped up version of the Treasury/large cap switching strategy with 450bps of incremental average annual excess returns, but 400bps of incremental annualized volatility.
Readers wishing to implement this switching strategy in their own portfolio would have owned the Russell 2000 in January 2013 given the 4% outperformance versus Treasuries in December 2012 (3.56% vs. -0.44%). An investor implementing this strategy would have been handsomely rewarded in January as the Russell 2000 produced a 6.26% return, besting Treasuries by 707bps. This January outperformance of small cap stocks would signal that this relative outperformance is likely to extend into February.
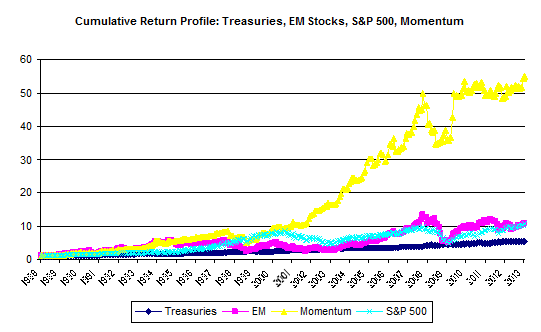
Treasury Bonds/Emerging Market Stocks
If substituting small caps for the S&P 500 further enhanced the risk/return profile of the momentum strategy, then moving into emerging markets should further increase both risk and expected return. With data from the MSCI Emerging Market Index (replicated through VWO) from 1989-2012, an enhanced momentum strategy is exactly what substituting emerging markets has historically produced.
(click to enlarge)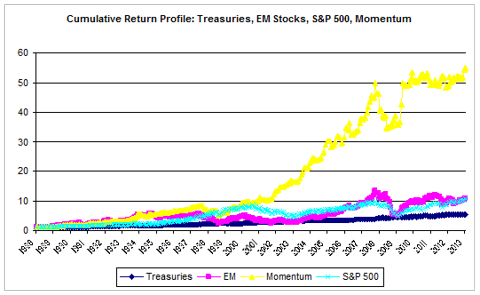
(click to enlarge)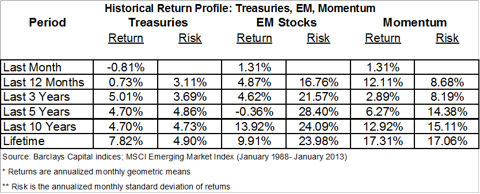
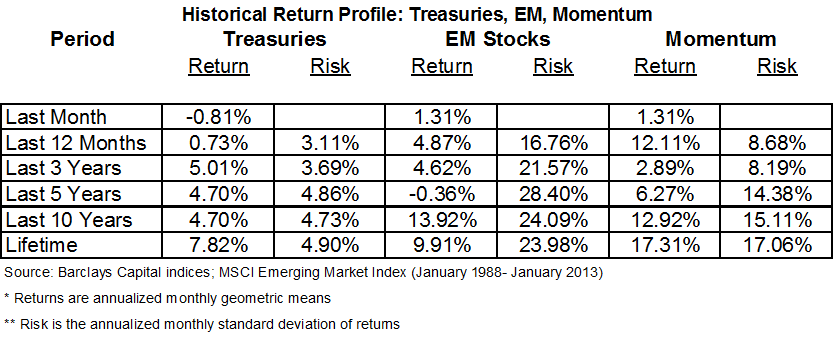
Emerging market stocks have been the most negatively correlated with Treasuries of the aforementioned equity asset classes (r=-0.17). EM stocks tremendous performance in the mid-2000s, which featured annual returns of at least 22% from 2003-2007, handed off nicely to the Treasury outperformance during the credit crisis. In the last ten years, this switching strategy has beat the S&P 500 by over 5.5% per annum with similar volatility. Over the totality of the dataset, EM stocks have been a high beta function of the developed world, and this momentum strategy has generated tremendous returns rotating towards the hot market during rallies and towards the safe haven of Treasuries during bear markets.
Of course, the trailing twenty-five years have been historically strong for both emerging market stocks and U.S. Treasuries, which I believe we will look back on in future periods as a historic anomaly. While investors should not expect a 17.3% annualized return over the next twenty-five years, I believe that this switching strategy will continue to produce alpha. Even in the trailing five years as emerging market stocks produced a negative cumulative return, this momentum strategy managed a 6.3% annualized return, which would have outperformed the S&P 500 on both an absolute and risk-adjusted basis.
Readers wishing to implement this switching strategy in their own portfolio would have owned emerging market stocks in January 2013 given the outperformance versus Treasuries in December 2012 (4.78% vs. -0.44%). These investors would have been rewarded in January with a 1.31% return, which lagged domestic equities, but outperformed high quality fixed income alternatives. Investors wishing to employ this strategy in February would continue in emerging market stocks.
Summary
For Seeking Alpha readers interested in gleaning long-term alpha through momentum, I will be updating the performance of these three trades (Treasuries/S&P500, Treasuries/Russell 2000, Treasuries/EM Stocks) at the end of each month. By providing performance over the trailing one month, momentum investors can follow along with these trades in their own portfolios. Please check out my aforementioned article on fixed income momentum strategies, and look for an inaugural article tomorrow on momentum trades within the equity universe that will also be updated monthly.
No comments:
Post a Comment